|
Pass the cursor over an area of the flowchart to
see more information.
|
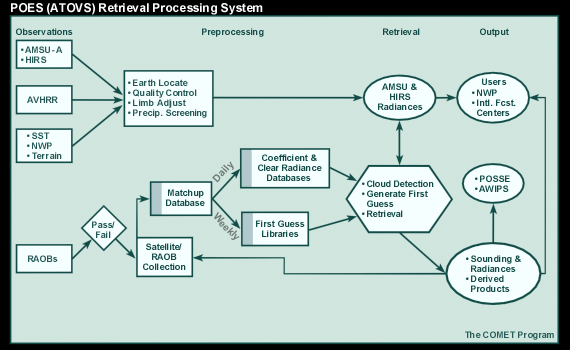
| The flowchart above depicts how POES sounder observations are transformed
into sounding data and derived products. Sounder measurements and ancillary
observations shown on the left side of the diagram are quality controlled,
adjusted and screened in a series of pre-processing steps. Matching with
a library of collocated RAOB data then results in first guess profiles
and prepares sounder radiances for actual retrieval of POES sounding profiles
and derived products which are shown on the right hand side of the diagram. |
The
Advanced Microwave Sounding Unit (AMSU) and the High-Resolution Infrared Radiation
Sounder (HIRS) sounder measurements received from the satellite consist of electronic
voltages and calibration information (also referred to as level-1b data).
The Advanced Very High-Resolution Radiometer (AVHRR) imager measurements received
from the satellite are the 5-channel radiometer electronic voltages and calibration
information (also referred to as level-1b data).
Ancillary
information includes NOAA operational sea surface temperatures, surface layer
temperature data from 6- and 12-hour NCEP NWP model forecasts, and terrain maps
from the Defense Meteorological Satellite Program (DMSP) surface product systems.
Terrain maps are produced with data from the DMSP's Special Sensor Microwave
Imager (SSM/I) and contain indicators of land, sea, coastal zone, ice, and snow
cover.
Sounder measurements preprocessing prepares the satellite sounder measurements
for output to users and for the retrieval of derived products. Steps include:
• Providing earth location for each sounder measurement
• Calibrating the Advanced Microwave Sounding Unit (AMSU)-A and High-Resolution
Infrared Radiation Sounder (HIRS) measurements to produce radiances for each
channel
• Performing gross error checks on all calibrated measurements
• Making limb adjustments of the HIRS radiances
• Testing AMSU-A radiances for precipitation contamination
• Making limb adjustments and interpolating the AMSU-A radiances to the
HIRS fields-of-view (FOVs)
• Collocating 17 Advanced Very High-Resolution Radiometer (AVHRR) FOVs
to each 17-km HIRS FOV
• Appending sea surface temperature, NWP, and terrain information to
each HIRS FOV
Sounder measurement output files store both calibrated and the calibrated plus
limb adjusted Advanced Microwave Sounding Unit (AMSU)-A and High-Resolution
Infrared Radiation Sounder (HIRS) data at the original sounder field-of-view.
HIRS files also include the 17 collocated Advanced Very High-Resolution Radiometer
(AVHRR) measurements (including means and standard deviation) for each AVHRR
channel, as well as cloud mask information.
The
three primary steps in the Advanced TIROS-N Operational Vertical Sounder (ATOVS)
retrieval algorithm are cloud detection, first guess formation, and product
retrieval.
• Cloud detection determines whether a given sounding retrieval location
is clear or cloudy. Clear retrieval uses High-Resolution Infrared Radiation
Sounder (HIRS) infrared channels to derive a first guess profile and sounding,
whereas cloudy retrieval is based only on microwave measurements from the Advanced
Microwave Sounding Unit (AMSU).
• The first guess profile is computed using a library search approach.
Ten collocations for which the sounding channels and radiosonde observations
agree best are averaged to produce first guess temperature, moisture, and radiance
temperature profiles.
• ATOVS temperature and moisture soundings are derived using a physical
retrieval approach. Moisture soundings particularly in cloudy regions are currently
inferior to those produced using the independent AMSU-B retrieval system. A
significant improvement in ATOVS moisture soundings is expected as AMSU-B data
are incorporated during spring/summer 2000.
The sounding products output file stores the derived temperature and moisture
sounding products (see Product Summary on the menu bar). These products include
the temperature and moisture profiles, first guess profiles, limb and non-limb
adjusted radiance temperatures (with the Advanced Microwave Sounding Unit (AMSU)-A
interpolated to the High-Resolution Infrared Radiation Sounder (HIRS) field-of-view),
first guess radiance temperatures, cloud mask, and ancillary information. Data
in this file is ported to POSSE (see Resources on menu bar) for display on the
Internet.
• NWP: NCEP regional models and Climate Prediction Center
• NWS forecast offices (available via AWIPS 5.0)
• Department of Defense weather services (U.S. Air Force and U.S. Navy)
• NASA: various groups
• International weather services and interests including: Australia,
Canada, China, ECMWF (European Centre for Medium-Range Weather Forecasts),
France, Germany, Japan, India, Israel, New Zealand, Russia, South Africa,
Taiwan
POSSE
was developed as a prototype graphical display system to prepare NWS regional
field office users for the migration of POES sounding products to AWIPS. POSSE
currently contains a large subset of the Advanced TIROS-N Operational Vertical
Sounder (ATOVS) derived sounding products (including the radiometric observations).
It is recommended that users consider POES ATOVS products primarily for temperature
and the separate Advanced Microwave Sounding Unit (AMSU)-B products for moisture
applications.
Radiosonde observation input includes global observations for the previous day.
Screening
radiosonde observations identifies those reports that contain a complete record
of atmospheric temperature and moisture information.
Radiosonde
and satellite observations are collocated on a daily basis. The criteria for
collocation are that observations are within 100 km of each other, within 6
hours of each other over sea, and within 3 hours over non-sea. Furthermore,
satellite observations must be of acceptable quality and no more than one collocation
is allowed for a given radiosonde and satellite sounding type (i.e., clear vs.
cloudy).
The
matchup database (MDB) file stores the latest thirty to sixty days of collocated
radiosonde and satellite observations. The file is updated daily and is carefully
compiled to retain a longer period of collocations in radiosonde-sparse regions.
Collocations are segregated for clear and cloudy sounding types, by latitude
belt, and for sea and non-sea regions. The MDB file becomes input for the daily
updating of first guess libraries and for the weekly updating of retrieval coefficients.
The
first guess library contains the collocated radiosonde and satellite observations
needed by the orbital processing system to compute the first guess temperature,
moisture, and radiance temperature profiles for each sounding location. Within
the first guess library are two sub-libraries, one for clear sounding and the
other for cloudy sounding types. These libraries also contain eigenvector principle
component scores for use in conjunction with the first guess library search
approach.
The clear radiance database (CRDB) contains samples of limb adjusted High-Resolution
Infrared Radiation Sounder (HIRS) and samples of limb adjusted Advanced Microwave
Sounding Unit (AMSU)-A observations, the latter interpolated to the HIRS and
field-of-view. These files are updated per orbit and are used to generate
regression coefficients for cloud detection tests.
The coefficient database (CDB) contains the regression coefficients used
for cloud detection tests, the eigenvectors and eigenvalues used in the first
guess library search, and the components of the minimum variance simultaneous
retrieval operator. All coefficients are updated daily.