1.0 Introduction

Welcome to the Operational Tropical Rainfall Potential (TRaP) module, developed by Sheldon Kusselson at the NESDIS Synoptic Analysis Branch (SAB). Many different organizations and individuals support the design and development of the TRaP product, so this really is a collaborative effort. Various versions of the tropical rainfall potential product have been available for the last 15 years. This module will cover the creation of the original version of TRaP and its evolution into the product available today.
The current generation of NOAA and DMSP microwave sensors provides quantitative information on global precipitation to enhance forecasts of potentially hazardous rainfall through tools like the TRaP technique Both NOAA and DMSP have contributed to the design of the next generation of microwave sensors that will fly on the NPP and NPOESS missions over the next two decades. The NPOESS satellite system will have vastly improved data latency, with 95 % of the data available to users within 28 minutes or less. CMIS and ATMS will provide all of the data of the previous generation of microwave instruments with improved resolution and greater multispectral capability. CMIS will also provide passively sensed wind speed and direction, a capability unavailable with previous generation of passive microwave radiometers.
1.1 Module Introduction
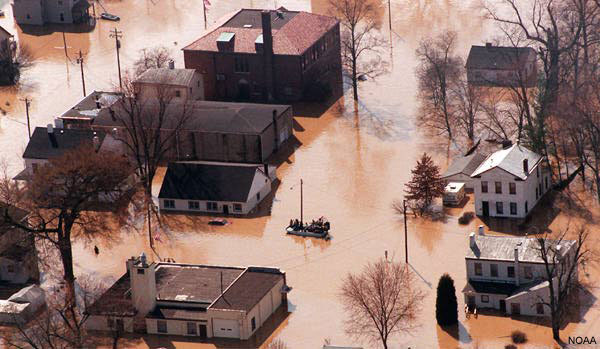
Flooding from hurricanes and tropical storms has resulted in considerable loss of property and more deaths in the United States than winds and storm surges combined. Dr. Edward Rappaport of the Tropical Prediction Center (TPC) found that in the United States, during the period between 1970 and 1999, fresh water floods accounted for more than half of the 600 deaths directly associated with tropical cyclones.
1.2 Module Outline
- Module Introduction
- TRaP Technique, Heritage, and History
- TRaP Products and Availability
- Examples from 2003
- Examples from 2002 - Part 1
- Examples from 2002 - Part 2
- Additional Examples
- Future Initiatives and Improvements
- Summary
Here is the outline for the module. After a brief introduction and look at TRaP heritage and history, the module focuses on more recent microwave TRaP products that provide guidance for potential tropical cyclone rain accumulation. Also included is information on TRaP availability on the Internet and current users. The TRaP Examples sections compare TRaP forecasts with observations and model forecasts for several storms from recent hurricane seasons. The examples provide a context for exploration of the strengths and limitations of the TRaP product. Next, future TRaP innovations are discussed. The module concludes with a short summary.
1.3 Module Objectives
- State the basis of the TRaP technique, its formulation, and inputs
- State the assumptions and the limitations of the technique
- Find and access TRaP products on the Internet
What does NPOESS bring to TRaP?
NPOESS will offer:- Improved spatial coverage
- Improved sensors (polarization, spatial resolution)
- Reduced data latency
This module demonstrates how microwave rain rates can provide guidance on potential tropical cyclone rainfall accumulations through application of the aerial TRaP product.
After completing the module, users will be able to:
- State the basis of the TRaP technique, its formulation, and inputs
- State the assumptions and the limitations of the technique
- Find and access TRaP products on the Internet
With this knowledge, forecasters can modify what they see in the product, so that they can improve the TRaP product for a particular area of interest.
What does NPOESS bring to TRaP?
NPOESS will offer:
- Improved spatial coverage
- Improved sensors (polarization, spatial resolution)
- Reduced data latency
1.4 Rainfall Forecasting for Landfalling Tropical Cyclone
- Forecasting rainfall from landfalling tropical cyclones is a difficult task
- Few rainfall observations are available with offshore storms
- Initializing numerical weather prediction models with enough detailed storm structure for accurate rainfall forecasts is difficult
- Radar observations available only when storm in close proximity to coast (within ~ 460 km/248 nm)
- Large gaps in radar coverage
Deriving total rainfall estimates for land-falling hurricanes is an inherently difficult task. Looking at observational data is often not enough because few rainfall observations are available offshore with a storm approaching land. Computer model output alone is also not enough because factors such as data assimilation and initialization can be problematic. Looking at radar data is insufficient because shore-based Doppler radar has a limited 250-mile range, and there are also large gaps in the radar’s coverage of any one storm. So, where else can forecasters look to find out what tropical cyclone rainfall is like while it is still offshore?
1.5 Polar-orbiting Satellite Systems
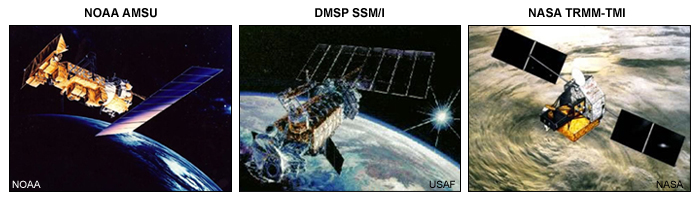
There are polar-orbiting satellite-based microwave radiometers that can measure instantaneous rain rates through clouds. The radiometers on the current generation of geostationary satellites are limited to visible and infrared detection, so they see cloud tops and don't really sense anything below cloud top height in most cases. Microwave radiometers, however, can penetrate through the entire cloud area of tropical cyclones and provide supplemental observational data to the forecaster. Information on cloud water, cloud ice, atmospheric moisture, and temperature are examples of this capability.
2.0 TRaP Technique,
Heritage, and History
2.1 Introduction
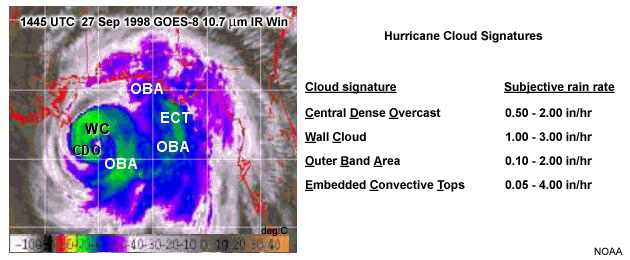
The heritage of TRaP actually goes back to the 1980s when it was a GOES (geostationary satellite) technique developed by Spayd and Scofield. The technique was subjective because, in essence, cloud signatures were assigned subjective rain rates. The TRaP formula then used those subjective rain rates in a long and laborious process to derive a single tropical rainfall potential number, the end product. But, these rain-rate values depended on cloud-top trends; hence, the large range in rain rates for particular areas of the tropical cyclone.
2.2 Leveraging Technology Improvements
NOAA Administrator:
- Emphasized the need to take advantages of new technology
- Described benefits of better observation systems/data collection
Panel Members on hurricane forecasting:
- Forecasters will depend on new systems and improve use of technology
- Observation systems have improved both space- and ocean-based data availability, timeliness, and quality
While looking at how to improve guidance for forecasters in the 1990s, the NOAA administrator felt that some of the new technologies coming on line were not being used to their full potential. He felt that new technologies need to employ new systems that use space- and ocean-based remote sensing products such as microwave observations.
2.3 Infusion of Microwave Observations
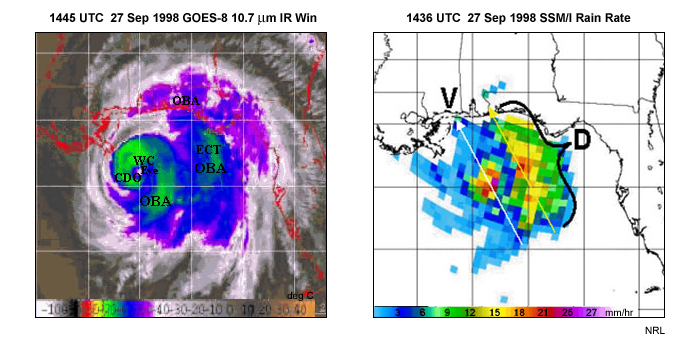
New satellite instruments and microwave sensing technology led to a transition from the subjective GOES technique for tropical rainfall potential to a more objective polar-orbiting satellite technique in the 1990s. This transition allowed big improvements in deriving rain rate estimates.
2.4 The TRaP Formula
TRaP = (Ravg * D)/(V - 1)
The current TRaP formula is a simplified form of the rainfall potential formula used with the GOES technique and relies on microwave rain rates from polar-orbiting satellites as one of the inputs.
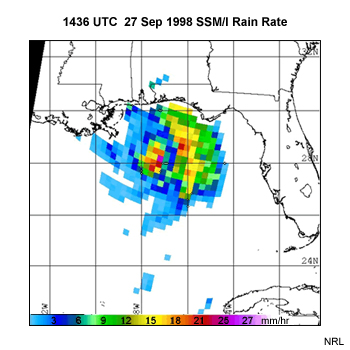
The microwave TRaP technique is used today to produce the tropical rainfall potential. Beginning in 1992, operational meteorologists from NOAA/NESDIS’ Satellite Analysis Branch (SAB) started looking at the rain-rate product produced by the polar-orbiting, Defense Meteorological Satellite Program’s (DMSP) Special Sensor Microwave Imager (SSM/I). The goal was to produce a rainfall potential for tropical disturbances expected to make landfall in the next 24 to 36 hours.
The example shown here is of the DMSP SSM/I microwave rain rate product for Hurricane Georges on the morning of 27 September 1998, when the storm was offshore and 12 to 24 hours from landfall.
2.5 Manual TRaP Technique
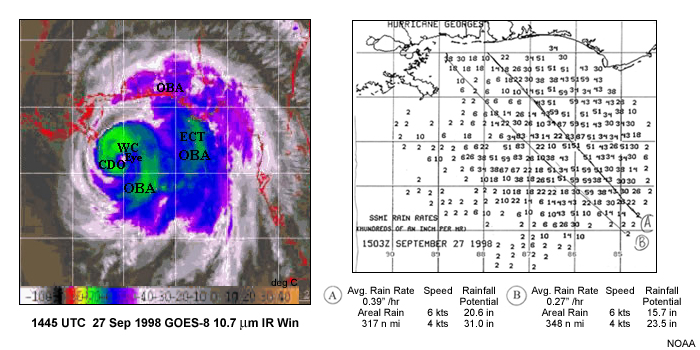
The microwave TRaP technique was once done manually by satellite analysts. It was time consuming to draw lines across the digital rain rate values and only produce one or two tropical rainfall potential numbers.
2.6 TRaP Technique Improvements 1
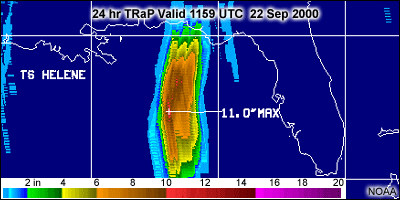
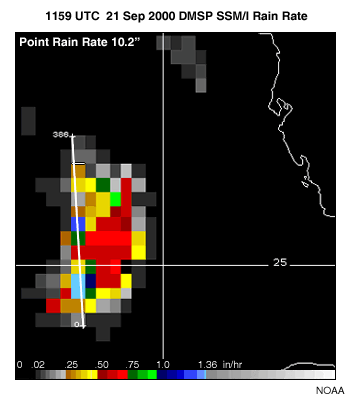
In 2000, more of the TRaP algorithm was automated and calcualted by the computer. It integrated all of the storm’s microwave rain rates to produce a graphical product based on the current movement of the storm, compared with just one rainfall potential number.
2.7 TRaP Technique Improvements 2
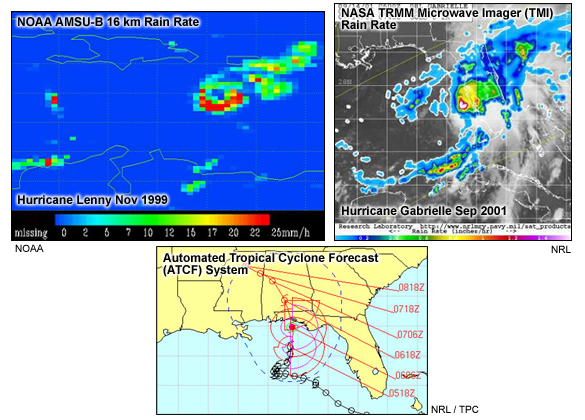
In 2001, major improvements included going to a higher resolution rain-rate product from the NOAA-15 Advanced Microwave Sounding Unit (AMSU) and using the Automated Tropical Cyclone Forecast System (ATCF) for the future movement and speed of the storm. Adding the NOAA-16 polar orbiter doubled the coverage for rain rates over a particular storm, providing the ability to do TRaPs every 6-12 hours. Another important addition was the use of the rain-rate product from the NASA Tropical Rainfall Monitoring Mission (TRMM) Microwave Imager (TMI). The first TRMM mission was launched in 1997 and continues to provide data into 2004.
2.8 Three Operational Microwave Polar-orbiting Satellite Systems
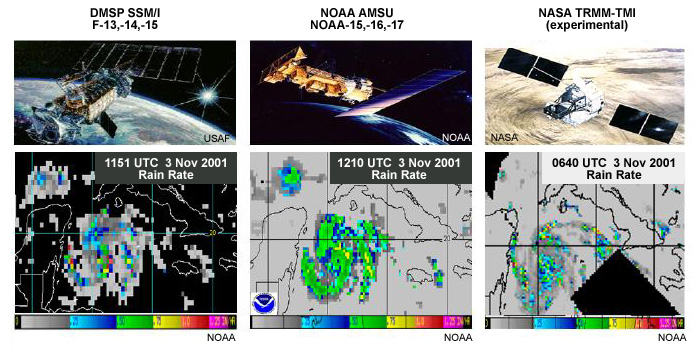
Today, tropical rainfall potential products are produced from the three satellite systems with microwave sensors. This example is from Hurricane Michelle in November 2001. Each satellite has different characteristics, and SAB makes use of the microwave rain rate data from all three. TRMM, unlike NOAA AMSU and DMSP SSM/I, is not a polar-orbiting satellite. It covers the tropics between 38 degrees north and 38 degrees south latitude.
When any of these satellites passes over a storm, a tropical rainfall potential can be generated automatically. As one can see, the TRMM TMI has a higher-resolution five-kilometer footprint compared to NOAA AMSU and DMSP SSM/I. However, one can get many more passes with the NOAA and DMSP satellites than with the TRMM, which generally sees only one pass over a given location in a 24-hour period. Each system has its own characteristics and all available satellite data are used to produce the TRaP product. This is also a good way to get people looking at tropical cyclone rainfall using platforms other than geostationary satellites.
2.9 Hurricane Michelle Example
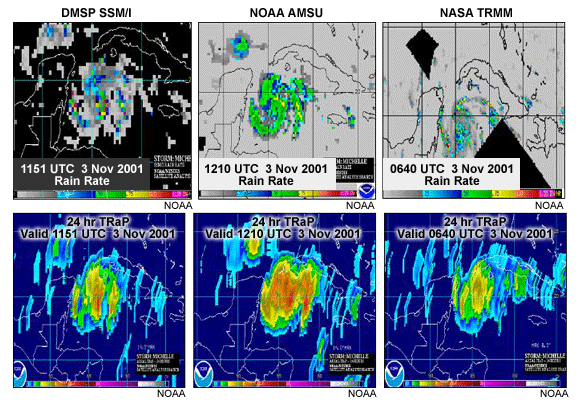
For Hurricane Michelle between 0643 and 1210 UTC on 3 November 2001, three different tropical rainfall potentials are produced while the storm is between the Yucatan Peninsula and Cuba. There are slightly different results for each satellite platform, because each of the satellite’s sensor and rain rate algorithms is different. In this case, the AMSU TRaP is higher than the TRMM.
2.10 TRaP Assumptions and Limitations
Assumptions:
- Satellite-derived rain rates are correct
- No change in the size, shape, and magnitude of the area of the rain rates
- Rain area moves in the forecast direction and speed of the storm
Limitations:
- No outside influences on the storm are permitted
- Presence of fronts/upslope conditions indicates need to increase TRaP value
- Presence of shear conditions indicates need to decrease TRaP values
- Presence of dry air entrainment indicates need to decrease TRaP values
Some of these assumptions are:
- The satellite-derived rain rates are correct. They are valid for the particular satellite’s snapshot pass over the storm, and the rain rates are only as good as the algorithms that go into producing the TRaP product.
- There is no change in the size, shape, or magnitude of the area of the rain rates. So, once you have that snapshot, the algorithm just assumes that those rain rates don't change at all for the next 24 hours.
- The rain area moves in the forecast direction and speed of the storm.
Some of the TRaP limitations are:
The TRaP technique cannot incorporate outside influences on the storm. In practice, however, there are many possible outside influences on a storm, so the following guidance should be used.
If there is a front and/or upslope conditions, a forecaster should know to increase the TRaP values. On the other hand, if dry air or shear are getting involved in the storm or will get involved over the next 24 hours as the storm approaches or makes landfall, then a forecaster should know to decrease the TRaP values. Examples where the TRaP algorithm does or does not do well will be presented later in the module. Most of the case studies indicate that the TRaP technique is accurate as long as these assumptions are reasonably well satisfied and their limits are taken into consideration by forecasters.
3.0 TRaP Products and Availability
3.1 Introduction
- TRaP Products on the Web
- TRaP Users
- Sample TRaP Products
3.2 Access to TRaP Products
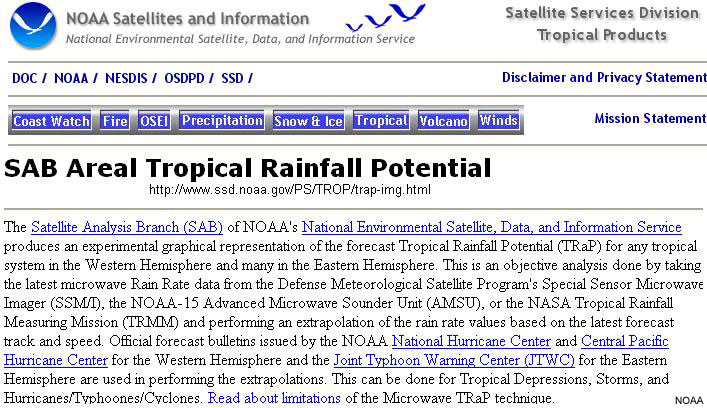
In the United States, most TRaP users are from the National Center for Environmental Prediction (NCEP), the Hydrological Prediction Center (HPC), and the Tropical Prediction Center (TPC). The National Weather Service’s Central Pacific Hurricane Center (CPHC) also uses the TRaP product when there are storms approaching the Hawaiian or other Pacific Islands. They are particularly interested in what kind of rainfall to expect as the storm approaches. Other places using the product are the National Weather Service Forecast Offices and National Weather Service River Forecast Centers, where they can at least view the product on the TRaP homepage, but cannot yet physically display digital data on a workstation at their offices. This functionality will be added in future iterations of the TRaP product.
SAB produces TRaP products for all of the Eastern Hemisphere whenever the storms are within 24 hours of landfall. Many countries have expressed a real desire to have this product, not just on the homepage, but in a digital format so that they can compare it with model guidance and observational guidance. Australia, Canada, India, Belize, Vietnam, and others are all viewing the TRaP product on the Internet.
TRaP Product Access:
Posting
- TRaP product posted to homepage
http://www.ssd.noaa.gov/PS/TROP/trap-img.html
- Customer e-mail notification
- FTP access to digital products
Generated Message:
Subject: New TRaP Created

    Date: Fri, 5 Sep 2003 17:55:33 GMT
Dear TRaP Customer,
A new TRaP has been generated in your area of interest. This TRaP was generated for FABIAN using 1438Z AMSU rain rate data and the 1444Z KNHC bulletin, and will be avaliable for 48 hours.
To access it please go to

    ftp://gp16.wwb.noaa.gov/pub/TRAP and find:
 2003FABIAN.WTNT45.KNHC.051444.AMSU.051438.24.Z

    2003FABIAN.WTNT45.KNHC.051444.AMSU.051438.24.txt.Z

    2003FABIAN.WTNT45.KNHC.051444.AMSU.051438.24.GIF
in directory "Atlantic"
For information on how to decipher the text file please see the document
      located in directory "README". If you have any questions or wish
      to have your name removed from our notification system, please contact Michael
      Turk.
TRaP Product Access:
E-mail Notification
Sheldon Kusselson or Michael Turk.
• Overview of the TRaP product
• Link to TRaP examples
• Verification information
• Product formats
3.3 TRaP Product Examples from Hurricane Lily
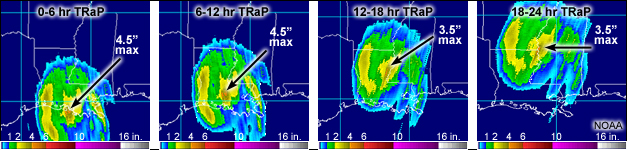
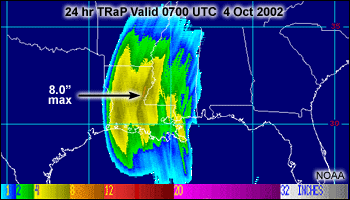
Here is an example of the various TRaP products that are now automatically
being produced in Camp Springs, Maryland. For each TRaP product that is produced,
four individual six-hour TRaPs out to 24 hours and one 24-hour composite can
be produced. Remember that the automatic TRaPs are generated any time a storm
is given a name or a number. This is one example from Hurricane Lily. Six-hour
TRaPs like the set shown here do not currently animate on the homepage, but
will sometime in the near future. Also planned for the Website are separate
pages that provide TRaP output organized by region. Currently, one 24-hour TRaP
graphic is available on the homepage.
4.0 Examples from 2003
4.1 Tropical Storm Bill 1 (July 2003)
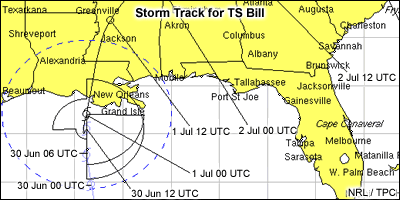
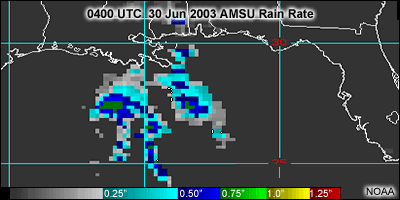
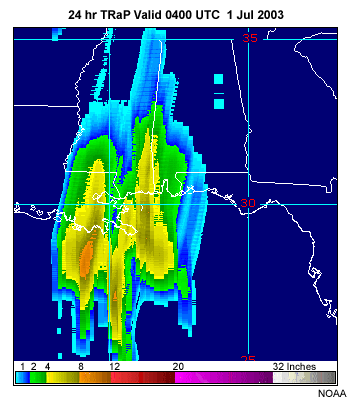
Tropical Storm Bill was a system that threatened the U.S. Gulf Coast in July,
2003. Here, the NOAA-16 AMSU provided a pass about 24 hours before the storm
made landfall.
4.2 Tropical Storm Bill 2
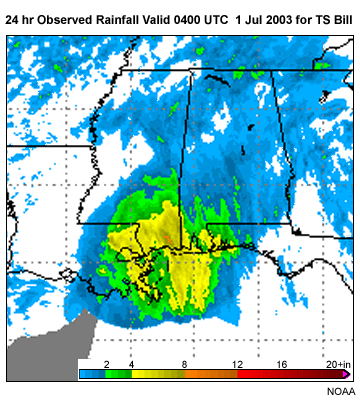
This slide compares the TRaP output with observed rainfall for tropical storm Bill. The observed rainfall product, also known as the Stage IV Quantitative Precipitation Estimate, is generated by NCEP and represents a quality-controlled 24-hour composite of rainfall estimates derived from multi-sensor observations including radar, satellite, and rain gauge.
The TRaP product did a good job of predicting the total rainfall amounts, but
the location of the TRaP rainfall is different from the observed rainfall.
4.3 Tropical Storm Bill
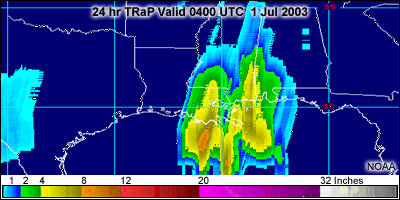
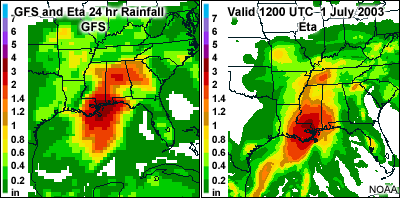
This slide compares 24-hour forecast rainfall totals from both Eta and GFS models with the TRaP and observed totals. Both of the model runs underestimated the total rainfall by a factor of two.
Looking at the rainfall observations, the maximum amount was on the southern
Mississippi/Alabama coast. The TRaP did rather well because the storm behaved
well, and it was a pretty good forecast based on that snapshot image. This case
nicely illustrates where satellite data provided good guidance to the forecaster.
4.4 Tropical Storm Bill Summary
- Little change in magnitude and area of rain rates
- Actual track of storm was faster and to the east
- Two parts of the storm merged to produce the final rainfall amounts
4.5 Hurricane Claudette 1 (July 2003)
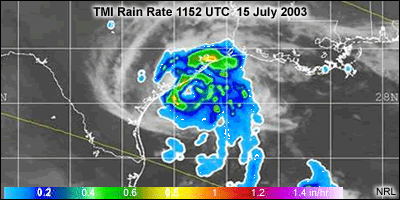
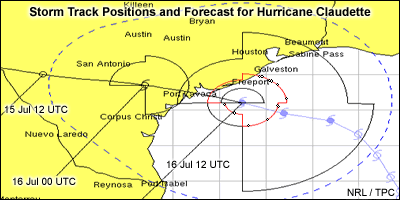
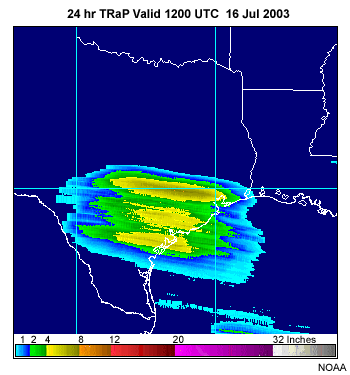
In 2003, Hurricane Claudette was bearing down on the Texas
coast when the NASA TRMM satellite provided instantaneous rain rates from its
recent pass. As can be seen in the TRaP image, three areas of heavy rain were
forecast by the TRaP product.
4.6 Hurricane Claudette 2

This slide compares the observed 24-hour rainfall on the left and the 24-hour TRaP product on the right. In this case, the TRaP product produced rainfall amounts consistent with the Stage IV-observed rainfall product.
4.7 Hurricane Claudette 3
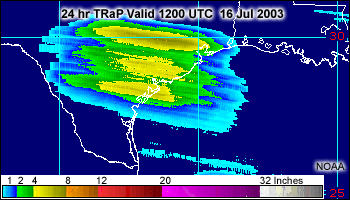
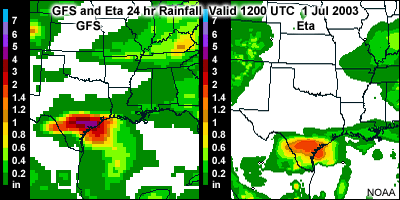
The GFS model did significantly better than the Eta model
on this storm, however, it still underestimated the total amounts by more than
an inch.
4.8 Hurricane Claudette Summary
- Little change in both area and magnitude of rain rates
- Good 24-hour forecast of storm's movement
- Rain areas moved in forecast direction and speed of storm
The TRaP product for hurricane Claudette performed quite well on the magnitude and overall coverage of rainfall.
Claudette took on a more westerly track and accelerated somewhat after making landfall, but maintained its speed and direction as it moved across Texas and towards northern Mexico.
Notice the inland spreading of the heavier 7- to 8-inch totals seen in the
24-hour TRaP product on the left. This is the result of extrapolation of more
intense convective elements that the TRMM rainfall product was able to resolve
just prior to the storm making landfall. Recall that the resolution of the
TRMM TMI is three times greater when compared with the AMSU or SSM/I. AMSU
and SSM/I would have considerably smoothed and underestimated these smaller
convective areas, so that the net effect on the 24-hour TRaP product would
also have been a reduction in the overall rainfall totals.
5.0 Examples from
2002 - Part 1
5.1 Hurricane Bertha 1 (August 2002)
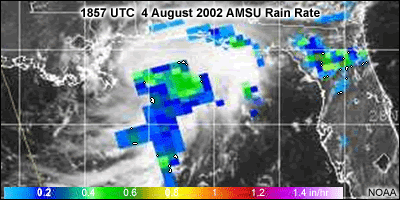
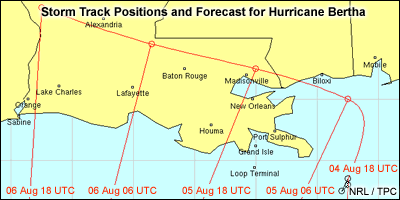
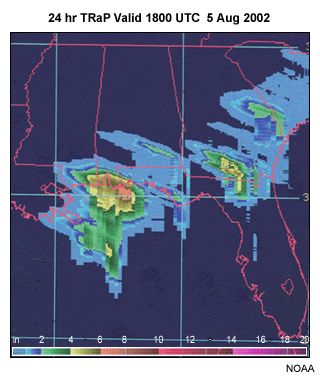
2002 was a busy season for the production of TRaPs, especially over the Gulf
of Mexico. Hurricane Bertha is one example. Whenever there is a complete pass
over a storm from a NOAA, TRMM, or DMSP satellite, a rain-rate image is extracted.
In this case, a NOAA AMSU pass was used as the storm was approaching southern
Alabama and southeast Mississippi. At the same time, the latest 24-hour tropical
storm track forecast is obtained from the TPC. To create the storm track, the
best human input is integrated with numerical model guidance, to forecast the
direction and speed of the storm within the 24-hour rainfall potential outlook
period. This track forecast is then used to create the TRaP product. In the
best storm forecasts, there is a lot of collaboration with the HPC, the National
Weather Service Office in Miami, and lots of other people before TPC puts out
that best track forecast. The computer generates a 24-hour rainfall potential
from that snapshot rain-rate image and the latest hurricane track forecast coming
out of TPC.
5.2 Hurricane Bertha 2
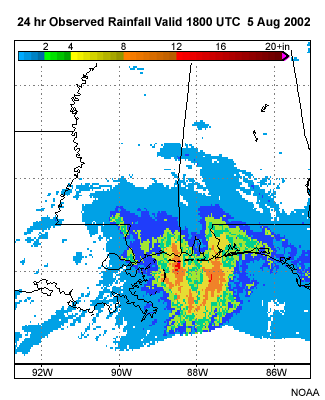
From the rainfall observations, you can see that the maximum amount was on
the southern Mississippi/Alabama coast. The TRaP did rather well because the
storm behaved well, and it was a pretty good forecast based on that snapshot
image. SAB looks at satellite data because satellite input may provide good
guidance to the forecaster.
5.3 Hurricane Bertha 3
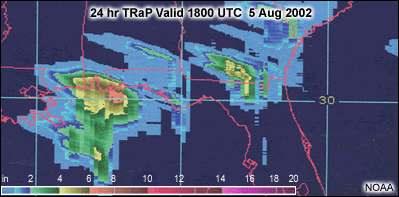
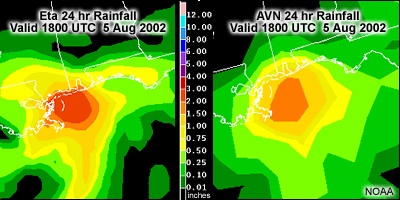
The numerical models can sometimes underestimate forecasts of tropical storm
rainfall. This is one of the reasons why SAB believes that using a product like
TRaP will provide useful guidance to forecasters and also provide useful input
to river forecast models. In the lower right panel, we can see that the GFS
precipitation forecast actually verified quite well compared to the Eta, which
had a little more trouble, particularly for some of the heavier, more localized
amounts.
5.4 Hurricane Bertha Summary
The TRaP product worked well in this case because there was little change in
the magnitude and area of rain rates as seen in that snapshot image. The whole
rain area of the storm moved in the direction and speed predicted, while outside
influences were minimal. These factors combined to give the forecaster confidence
in the TRaP output for the storm as it headed toward southern Alabama and southeast
Mississippi.
5.5 Tropical Storm Fay 1 (September 2002)
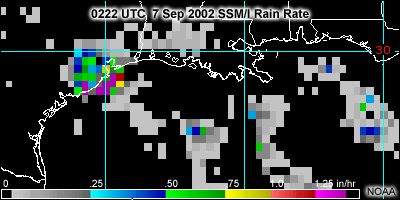
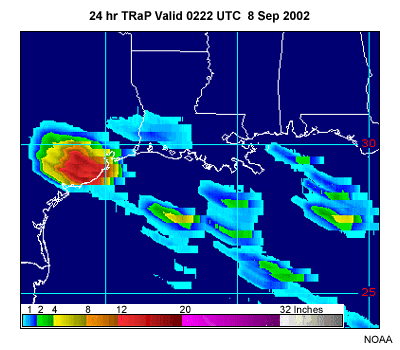
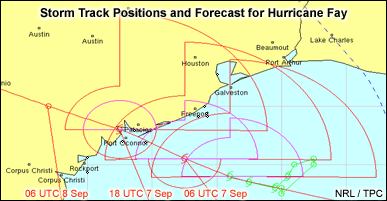
Tropical Storm Fay was a bit different from Bertha. The TRaP product started
out with an SSM/I pass of the storm. A large area of rain, with very high rain
rates of more than 1¼ inch per hour, was observed. The SSM/I, however,
has a 15-kilometer resolution. So a few more localized intense rain-rate areas
probably existed within that 15-kilometer box. Taking the storm track forecast
from TPC, a tropical rainfall potential product was derived and displayed on
the SAB TRaP homepage.
5.6 Tropical Storm Fay 2
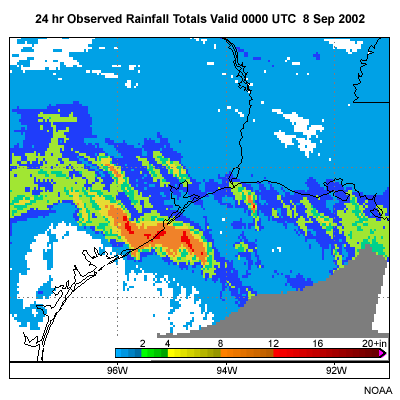
This slide shows a comparison between the TRaP product and the observed rainfall for Tropical Storm Fay. Since the TRaP product is somewhat of an extrapolation from the instantaneous rain rate, it often shows larger areas of rainfall potential with larger maximum amounts.
The maximum amounts worked pretty well, but the aerial extent smaller, which implies that the storm probably weakened as it moved inland, with the intensity near the center staying about the same. This kept the maximum amount fairly accurate, but that maximum amount was focused closer to the center of the storm as it moved inland.
5.7 Tropical Storm Fay 3
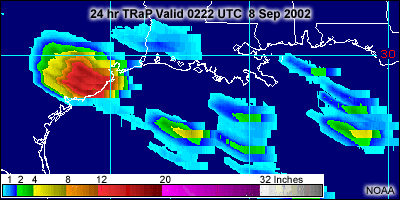
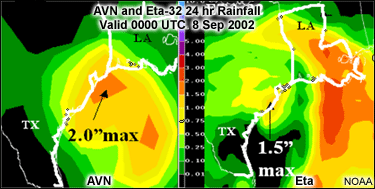
How did the model guidance do? If you had looked at model
guidance from the AVN and the Eta-32 runs that evening, you probably would have
tossed it into the trash can. The models didn't really give you very much in
the way of guidance. There is a lot of satellite data that does go into the
models, but there may have been a problem with data assimilation. The TRaP model
isn't in competition with the models. It is another guidance product for the
forecaster to look at, especially if there is little faith in the model forecast
for a storm as it moves inland.
5.8 Tropical Storm Fay Summary
To summarize, for Tropical Storm Fay there were some changes
in both the area and magnitude of the rain rates. That is probably why the area
of rainfall potential was smaller than the TRaP product showed. The rain area
did move in the forecast direction and lined up well with the observed track.
The storm experienced a minimal amount of outside influence, such as the movement
into a very moist environment with no shear or dry air intrusion, so the TRaP
forecast remained relatively accurate.
5.9 Tropical Storm Hanna 1 (September 2002)
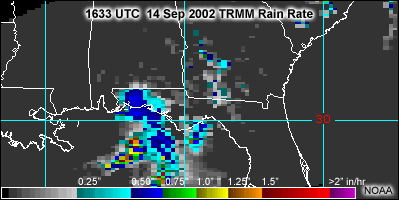
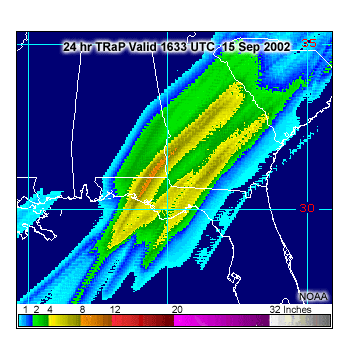
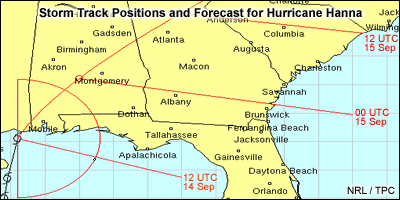
For Tropical Storm Hanna, the rain-rate image shown here
came from the NASA TRMM satellite. The TRaP product shows the 24-hour rainfall
potential based on the instantaneous rain rate and the storm track from TPC.
How did the TRaP product perform for this case?
5.10 Tropical Storm Hanna 2
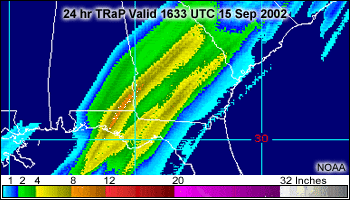
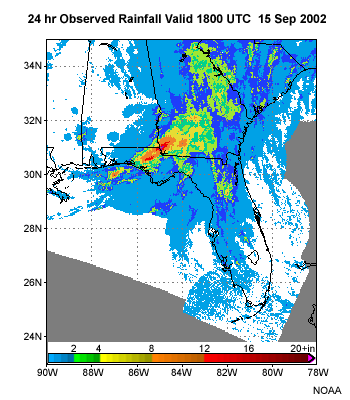
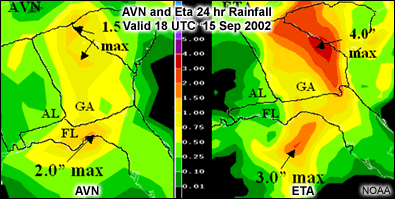
Again, for reasons stated earlier and for other reasons that are unknown at
this time, the models tended to have a hard time generating sufficiently heavy
precipitation with these storms. The TRaP product can supplement model forecasts,
even though this TRaP underestimated the total rainfall amounts somewhat. There
could have been more outside influences as the storm penetrated further inland.
Another point to keep in mind is that the performance of an extrapolation technique
like TRaP tends to degrade toward the end of the 24-hour period. And that degradation
is even more evident in cases where outside influences on the storm are more
pronounced.
5.11 Tropical Storm Hanna Summary
Hanna was an example where both the model and TRaP rainfall
amounts were lower than the observed totals. The TRaP forecast total, however,
was much closer to the final amount. The storm did follow the forecast track,
but there was some change in the area and magnitude of the heaviest rainfall
totals.
6.0 Examples from 2002 -
Part 2
6.1 Tropical Storm Edouard 1
(September 2002)
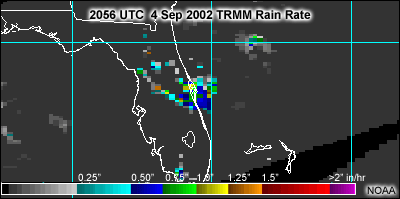
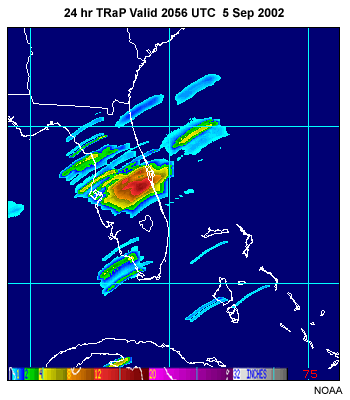
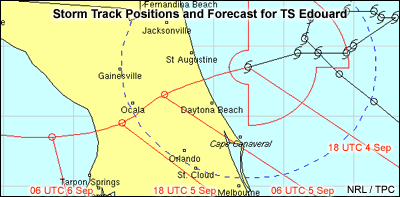
Just to illustrate that not all TRaPs perform that well, here are some examples
in which TRaPs did not do very well. Tropical Storm Edouard is a classic. This
storm had intense rain rates, a well-defined storm structure, and was generally
forecast well by the TPC. Indications were of a slow moving storm with very
high rain rates. The TRaP output produced 16 inches of rain. However, did 16
inches of rain fall on the Florida coast?
6.2 Tropical Storm Edouard 2
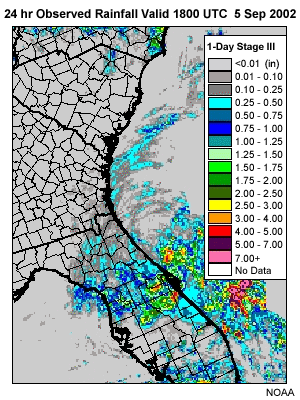
The 24-hour observed rainfall totals shown here indicate that Edouard only produced a 4.5 inch maximum over portions of central Florida.
Why didn’t the storm produce 16 inches of rain as the indicated by the TRaP product?
6.3 Tropical Storm Edouard 3
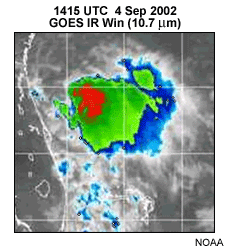
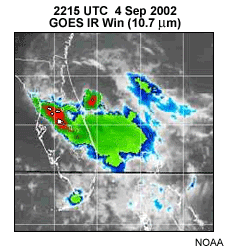
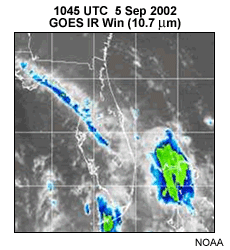
There are three reasons why the TRaP product underestimated the rainfall with
Edouard. First, the system was sheared. Second, there was dry air entrained
into the storm. Third, just as it was making landfall, the storm suddenly sped
up from that snapshot image at 2056 UTC on 4 September. The somewhat slower
TPC track forecast that provided input for the TRaP resulted in an overestimate
of rainfall amounts. Those were the three big factors responsible for decreasing
the rain rate during that 24-hour period of the TRaP product. So it is not surprising
that what eventually fell was one-fourth of what the TRaP product forecast.
6.4 Tropical Storm Edouard Summary
To summarize for Tropical Storm Edouard, there was significant
shear impacting the system that weakened the storm in this sequence of images.
The storm pretty much fell apart as it crossed into central Florida. Three factors
worked together to lessen the actual rainfall totals: environmental shear, dry
air entrainment, and increased storm motion.
6.5 Hurricane Isidore 1 (September 2002)
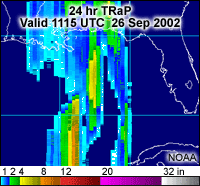
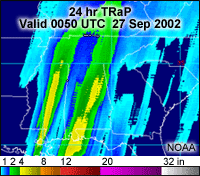
Hurricane Isidore is another interesting example. This storm had a rebirth
of sorts after leaving Mexico and falling apart in the central Gulf of Mexico.
As a result, the TRaP product was highly disorganized. Twelve hours later over
the Central Gulf, the storm became better organized, as did the TRaP product.
By the time Isidore approached the Central Gulf Coast of the U.S. mainland on
the morning of 26 September 2002, the storm had become much better organized.
What do you think the TRaP product showed?
6.6 Hurricane Isidore 2
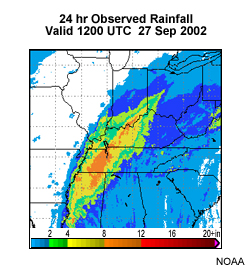
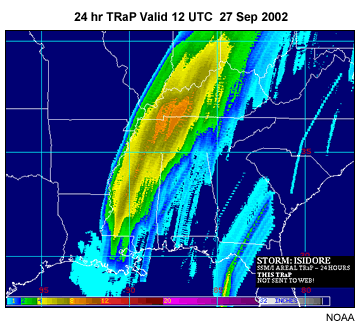
The TRaP product showed a little bit better organization. Usually the TRaP
product is not produced when the storm is very close to the coast, mainly because
microwave rain rates are more accurate over water than over land. Also, forecasters
have their radar to look at once most of the storm rainfall is over land. In
this case, there were some pretty good rain rates close to the coast. The storm’s
center was just offshore and the TRaP product actually worked out fairly well.
It is known that a weakening storm necessitates a decrease in rain amounts.
That would normally be the case. But here, Isidore encountered a frontal system
that helped increase the TRaP amount and offset the effects of the storm weakening
over land.
7.0 Additional Examples
7.1 Hurricane Lili 1 (October 2002)
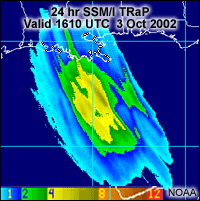
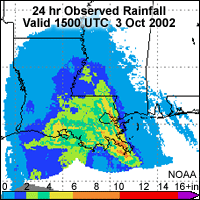
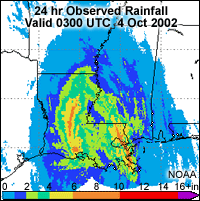
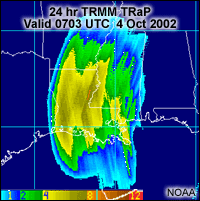
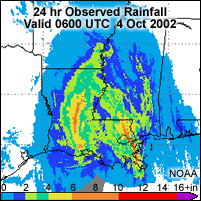
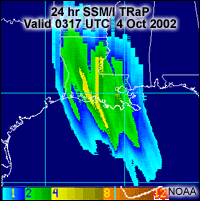
This slide shows some TRaPs from Hurricane Lili and the associated verification
data. A polar-orbiting pass has to show better than 75% of the rainfall in the
storm to be used as part of a TRaP product. In this case, in the period before
landfall, there were at least three good passes over the storm to produce 24
hour TRaP guidance products. Focus on the observed rainfall images in the lower
portion of the slide. As often happens, especially when a storm is at least
24 hours from landfall, a lot of the convection starts developing after the
snapshot image. The result is that this newer convection does not get incorporated
into the TRaP product. So, in many cases, a lot more rainfall is generated well
out ahead of the TRaP product guidance, especially when the storm is 18 to 24
hours from landfall. As the storm gets closer to landfall, rainfall estimates
seem to get a little bit better, as was seen with this example.
7.2 Hurricane Lili 2
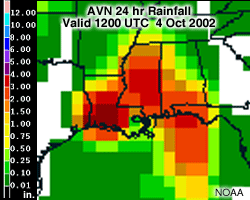
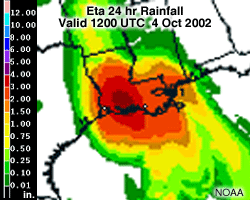
These images compare computer guidance with the TRaP output (upper left), and the Stage 4 rainfall totals (upper right). Notice that both AVN and Eta models underestimated the forecast rainfall amounts.
By exploiting the various satellites available to operations, the TRaP product for this case clearly demonstrates the ability of satellite-based guidance to help improve forecasts for critical weather situations like the tropical cyclone expected to make landfall.
7.3 Tropical Storm Helene 1 (September 2000)
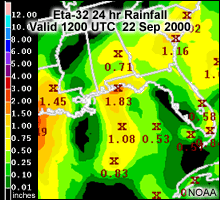
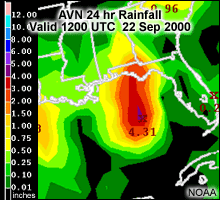
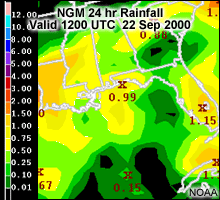
Tropical Storm Helene was an operational case from September 2000. TRaP guidance
will be compared with model data and observations. This slide shows the TRaP
forecast for Helene. TRaP output was generating a maximum amount of 11 inches
over the Gulf of Mexico, whereas none of the models was forecasting more than
about four inches. This was guidance information provided to the NCEP HPC Branch,
which is co-located with the SAB within the National Precipitation Prediction
Unit.
7.4 Tropical Storm Helene 2
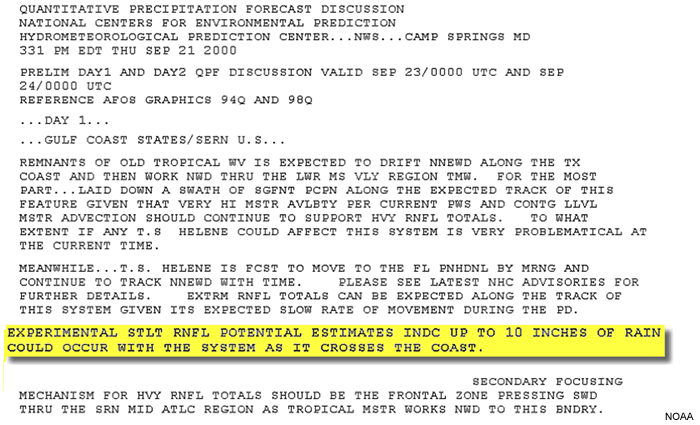
HPC forecasters used the TRaP rainfall guidance in their discussion material
as the storm approached landfall. None of the computer model forecasts were
indicating amounts comparable to the TRaP product as the storm approached the
Florida coast.
7.5 Tropical Storm Helene 3
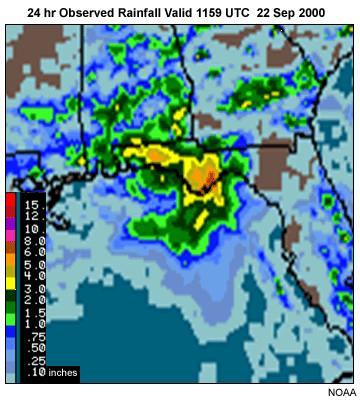
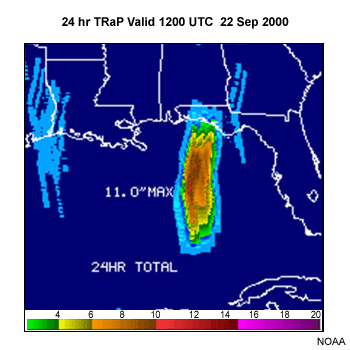
This slide compares the 24-hour TRaP output with observed rainfall totals for the same period. Even if the TRaP guidance was too slow, it would have given the forecaster an indication that rain amounts in excess of those predicted by the models, were possible along the coast and inland. This case illustrates that the TRaP product may give a heads up to the forecaster of the potential for heavy rainfall as a tropical cyclone nears the coast and moves inland.
As mentioned earlier, the convection ahead of the tropical cyclone is often completely missed by that snapshot polar-orbiting satellite image. This means that when the TRaP is generated 24 hours from landfall, it will often appear to be a little slow in bringing that heavier amount to the coast. TRaP will otherwise do a pretty good job of giving the forecaster an idea of how much rain to expect as the storm itself comes inland.
7.6 International Support - Caribbean Examples from 2002
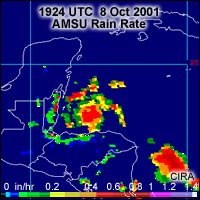
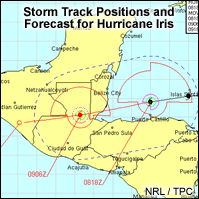
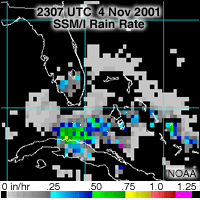
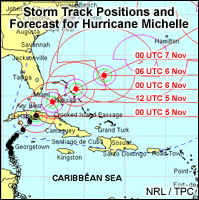
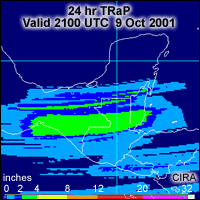
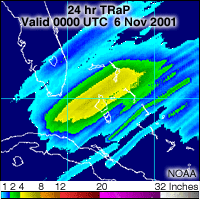
As mentioned previously, TRaPs are not produced for the U.S alone. SAB is building
international support. Here are some examples from the Caribbean: In 2001, Iris
went into Guatemala. In the same year, Michelle went across Cuba and strayed
just south of Florida. SAB is trying to build support for TraP not just in the
United States and the Western Hemisphere, but also globally.
7.7 Summary
There is a lot more work to be done. By no means has TRaP
development reached an end. Currently TRaP is not fully automated. An operational
satellite meteorologist will look at TRaP output when a storm is within 24 to
36 hours of landfall to make sure that all of the rain in the storm is covered,
and that the TRaP product looks reasonable before it is made available on SAB’s
homepage. A number of initiatives and improvements have been identified for
TRaP and are reviewed on the following pages.
8.0 Future Initiatives and Improvements
8.1 Introduction
- SAB partnerships with NWS River Forecast Centers
- Validation efforts
- Six-Hourly TRaPs organized by worldwide storm basin
- Continued evaluation of the Hydro-Estimator
- Development of a Tropical Rainfall Nowcaster (TRaN) for storms over land
Second, SAB plans to continue its validation efforts, comparing TRaP outlooks with combined Eta model output and rainfall observations.
The third item addresses output on the Web. SAB would like to begin offering 6-hourly TRaPs and organize those products by worldwide storm basin.
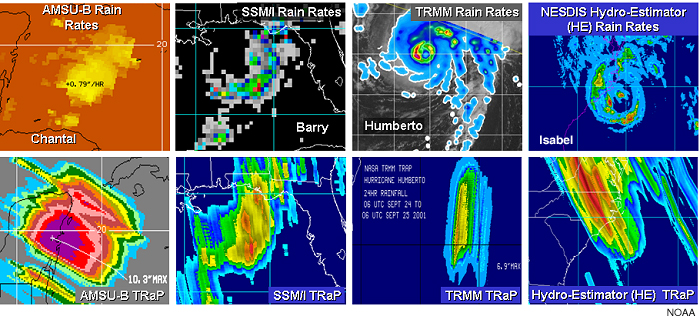
For the fourth item, SAB plans to continue its evaluation on the NESDIS Hydro-Estimator. This is an example of a TRaP that was evaluated for Isabel, using one-hour rain rates produced by the Hydro-Estimator. This evaluation will be continued for the 2004 Western Hemisphere hurricane season.
The fifth item on the list addresses an effort ot develop a Tropical Rainfall Nowcaster (TRaN) for storms over land.
8.2 An Example of Digital Output to Users
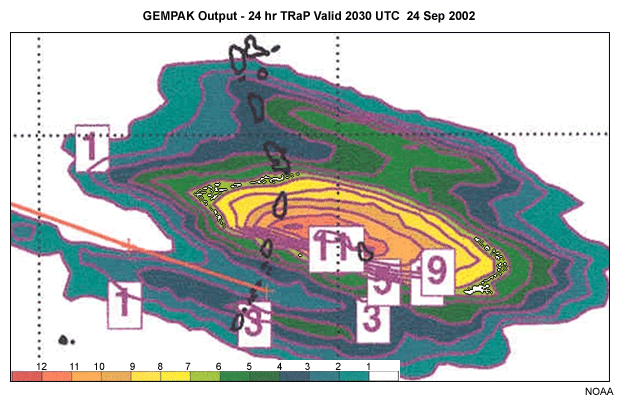
This past summer, a TRaP graphic from the 2002 hurricane season was successfully
sent to the NCEP TPC. They were able to convert the digital file to an image
product and display it on their N-AWIPS workstation. In the future the plan
is to take TRaPs that are generated and delivered to the NCEP TPC, display them
on their N-AWIPS workstations and then make them available to the NCEP HPC through
their N-AWIPS workstations. Since the TRaP product will not be on AWIP’s
at NWS forecast offices, hopefully those offices interested in obtaining TRaP
guidance will be able to somehow display it in their office so they can use
it as guidance for rainfall prediction when a storm is within 24 to 36 hours
of landfall.
8.3 Tropical Rainfall Nowcaster (TraN)
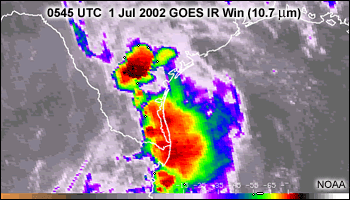
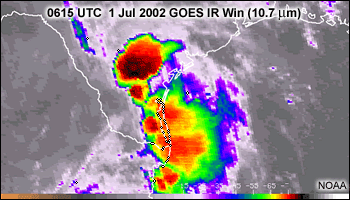
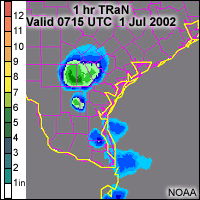
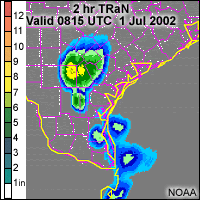
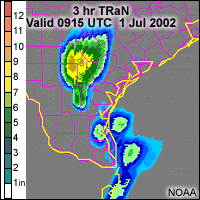
Rod Scofield of NESDIS has started development on a tropical rainfall nowcaster for storms that are over land, referred to as the TRaN.
As mentioned earlier, the current microwave sensor and algorithms tend not to do as well with identifying rain over land. This slide provides a preview of what the tropical rainfall nowcaster will look like for storms over land. The slide is from one of Rod Scofield's latest presentations that he has shown at various conferences.
The product is a nowcasting tool that uses the GOES Hydro-Estimator
hourly rain rates as input for when tropical disturbances are within 6 hours
of landfall, to when they dissipate over land. Possibly further in the future,
the Hydro-Estimator or a blended GOES-Microwave Rain Rate product can be used
to produce projections of rainfall like the TRaN.
9.0 Summary
9.1 TRaP Summary
- TRaP is an objective satellite-based technique for forecasting rainfall from tropical cyclones expected to make landfall within 24 to 36 hours
- TRaP is most useful while a storm is offshore, where few rainfall observations are available
- Users of the TRaP product include a broad community of domestic and international forecasters
To summarize, TRaP is an objective, satellite-based technique that provides guidance for rainfall totals from tropical cyclones that are expected to make landfall within a 24 hour period. In some cases the product is generated out to 36 hours if SAB thinks the storm's rainfall will be relatively stable as the storm approaches the coast. TRaP is most useful offshore where there are few additional rainfall observations. HPC forecasters use an integrated approach including numerical and statistical guidance products, radar, satellite data, and the TRaP product in producing their QPFs for landfalling tropical cyclones. There is significant collaboration between scientists, modelers, and forecasters in a coordinated effort to produce the best rainfall total estimates.
Users of the TRaP product include a broad community of domestic and international forecasters.
TRaP initiatives include:
- Providing digital TRaP output to users
- The continuation of validation exercises
- Development of a TRaN Product for storms over land
Polar Satellite Microwave Sensing Capabilities for Observing Rainfall
Near-term:
- Continued microwave observation of global rain rates with existing POES satellites, offering local coverage up to six times daily
- Global coverage thru 2010 with NOAA-AMSU, MetOp-AMSU, DMSP-SSM/I, and DMSP–SSMIS
Long-term:
- Enhanced microwave sensor technologies with NPP (expected 2006) and NPOESS (expected 2010), offering:
- Continued local coverage with a three satellite operational configuration
- More timely availability of data and derived products (95% within 28 minutes)
- Increased spatial coverage and elimination of orbital gaps
- Increased spatial resolution and improved diagnosis of convective rain rates
- Enhanced spectral coverage and polarization capabilities for improvement in rain rate estimates
- MetOp is expected to continue mid-morning AMSU coverage from 2005 thru 2019
9.2 Contacts, Resources, and Internet Links
This slide lists some contacts, resources, and verification links for TRaP. SAB is not afraid to show its verification data even if it does not always meet expectations. Forecasters know how difficult rainfall predictions are. Obtaining quality observational rainfall data can be difficult and collecting that data is often a chore. This is especially true in tropical cyclone situations with the wind blowing in excess of 50 mph (43 kt, 22 m/s). At NESDIS SAB, personnel have made an effort to verify TRaPs with total rainfall amounts observed over land. Anyone is more than welcome to browse the verification FTP sites shown here. They will give you a clearer sense of how NESDIS is verifying the TRaP product.
Contacts for More Information:
- Sheldon.Kusselson@noaa.gov.................for TRaP info
- Ralph.R.Ferraro@noaa.gov......................for Microwave info
- Antonio.Irving@noaa.gov........................for Automated TRaP
Resource Links:
TRaP
Homepage at NESDIS
Site provides access to the latest TRaP (Tropical Rainfall Potential) information
and products. Includes a link to TRaP graphics and rainrate imagery archived
for the past year's tropical cyclones covering both Western and Eastern Hemispheres.
Polar
Satellite Learning Resources
Learning
resources for polar meteorological satellites. Links provide information on
polar satellites, imagery, derived products, data access, and related training.
Atlantic
and Caribbean Tropical Satellite Imagery at NESDIS
Site provides access to real-time imagery for tropical regions from NOAA, DMSP,
TRMM-TMI, GOES, METEOSAT and GMS satellites. Visible and infrared imagery are
included from GOES, GMS and METEOSAT and microwave image products (brightness
temperature, precipitable water, rain rate, ocean surface winds (DMSP-SSM/I
only)) from NOAA, DMSP and TRMM-TMI. Links to polar satellite-based sea surface
temperatures are also provided.
East
and Central Pacific Satellite Imagery at NESDIS
Site provides access to real-time imagery for tropical regions from NOAA, DMSP,
TRMM-TMI, GOES, METEOSAT and GMS satellites. Visible and infrared imagery are
included from GOES, GMS and METEOSAT and microwave image products (brightness
temperature, precipitable water, rain rate, ocean surface winds (DMSP-SSM/I
only)) from NOAA, DMSP and TRMM-TMI. Links to polar satellite-based sea surface
temperatures are also provided.
Verification Links:
TRaP
Verification Statistics for 2002 Atlantic Basin Hurricane Season
Access to a table and charts of various statistical performance measures applied
to the TRaP technique throughout the 2002 Atlantic hurricane season.
Select
TRaP Rainfall Forecast Verification Graphics
ftp://gp16.wwb.noaa.gov/pub/volcano/Kusselson/JHTTRaPObsModelExamples.ppt
Access to TRaP rainfall forecast verification graphics for a selection of landfalling
tropical cyclones during the 2001, 2002 and 2003 Atlantic Hurricane Seasons.
9.3 References
There have been a number of references, especially in the last four years on the microwave portion of the TRaP technique. This page lists those references and where they appear in the literature.
Ferraro, R.R., P. Pellegrino, S.J. Kusselson, M. Turk, and S.Q. Kidder, 2002: Validation of SSM/I and AMSU derived tropical rainfall potential (TRaP) during the 2001 Atlantic hurricane season. NOAA Tech. Report NESDIS 105, 43 pp.
Kidder, S.Q., S. Kusselson, J. Knaff, R. Kuligowski, 2001: Improvements to the experimental tropical rainfall potential (TRaP) technique. Preprints, 11th Conf. on Satellite Meteorology and Oceanography, Madison, WI, Amer. Meteor. Soc., 375 - 378.
Kidder, S.Q., M. Goldberg, R. Zehr, M. DeMaria, J. Purdom, C. Veldon, N. Grody, and S. Kusselson, 2000: Satellite analysis of tropical cyclones using the advanced microwave sounder unit (AMSU). Bull. Amer. Meteor. Soc., 81, 1256-1257.
Scofield, R.A., R. Kuligowski, and C. Davenport, 2003: From satellite quantitative precipitation estimates (QPE) to nowcasts for extreme precipitation events. Preprints, 17th Conference on Hydrology, Amer. Meteor. Soc.
Spayd, L.E., Jr., and R. A. Scofield, 1984: A tropical cyclone precipitation estimation technique using geostationary satellite data. NOAA Tech. Memo. NESDIS 5, 36 pp.
Turk, M.A., S.J. Kusselson, R.R. Ferraro, P. Pellegrino, S. Kidder, and J.
Yang, 2003: Validation of a microwave-based tropical rainfall potential (TRaP)
for landfalling tropical cyclones. Preprints, 12th Conference on Satellite
Meteorology and Oceanography, Amer. Meteor. Soc.