NOTE: If you wish to print this page, please use the "Page Setup" item from the "File" menu in your browser to set the orientation to "Landscape" format (11" wide by 8.5" high). This will insure that the page prints correctly.
1.1 Overview
1.1a What
is Imagery?
1.2 Polar-orbiting Satellite Coverage
1.3 Southern California Fires: F15 OLS
Nighttime Visible
1.4 Southern California Fires: AVHRR
1.5 Southern California Fires: MODIS
1.6 Southern California Fires: MODIS
Zoom
1.7 Using MODIS/VIIRS for Burn Scar
Identification
1.8 Summary
2.0 VIIRS Resolution Improvements
2.1 MODIS: Three Spatial
Resolutions
2.1a VIIRS
Radiometric Performance
2.2 VIIRS: Two Spatial Resolutions
2.2a VIIRS Resolution Improvement
2.3 Satellite Resolution Grids
2.4 AVHRR Contributions to VIIRS Spectral
and Spatial Resolution
2.5 AVHRR Imagery over Italy
2.6 Advances in Sea Surface Temperature
2.7 Summary
3.1 OLS Direct Readout:
Fine vs. Smooth Mode
3.2 OLS Direct Readout: Fine Mode
3.2a Archived OLS Data
3.3 OLS Smooth and Fine Data over the
Mediterranean
3.3a Fine
vs. Smooth in the Nighttime Visible Channel
3.4 OLS Viewing Dust over the Arabian
Peninsula
3.5 MODIS Dust Product with COAMPSTM
Model Winds
3.6 Summary
4.1
Introduction
4.2 OLS and AVHRR at Edge of Scan
4.3 Dramatic Spatial Resolution and Sampling Improvements
4.4 OLS and AVHRR at Edge of Scan over Hawaii
4.5 Pixel Growth at Edge of Scan
4.6 AVHRR and VIIRS Visible Simulations
4.7 Summary
5.0 True-Color Imagery with VIIRS
5.1 Introduction: SeaWiFS
and MODIS Contributions
5.2 True-color Enhancement
5.3 Polar Eddies in the Davis Strait
5.4 Hurricane Isabel at Different Resolutions:
GOES Imager
5.5 Hurricane Isabel at Different Resolutions:
AVHRR
5.6 Hurricane Isabel at Different Resolutions:
MODIS and VIIRS
5.7 Combining True Color and High Resolution:
Bangladesh Coastline
5.8 Combining True Color and High Resolution:
San Diego Coastline
5.9 MODIS Monitoring Volcanic Ash
5.10 MODIS
Imaging Fog from Space
5.11 Imaging
Red Tides near the Florida Coastline
5.12 SeaWiFS
Dust Enhancement
5.13 Summary
6.1 Introduction
6.1a More
information on OLS and VIIRS Day/Night Channels
6.2 No Moon
6.3 Half Moon, First Quarter Phase
6.4 Full Moon
6.5 No Moon Image
6.6 Moon - Nearly Half Full Image
6.6a Lightning
with the Nighttime Visible Channel
6.7 Moon Nearly Full Image
6.7a
Solar Glare Contamination
6.8 Aurora
6.9 East Coast Lights
6.10 Clouds
Obscure View Over Texas: No Moon Case
6.10a More
Information on Nighttime Cloud Imaging:
Cloud Identification
Using the OLS IR and Nighttime Visible Channel
6.11 Bispectral
Composite for Highlighting Clouds
6.12 Tropical
Cyclone Imaging at Night
6.13 Quick Quiz
6.14 Summary
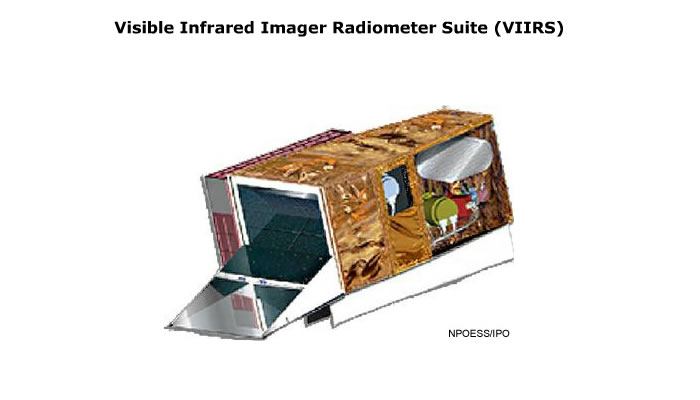
This module introduces the next-generation imagery that will be produced from the Visible/Infrared Imager/Radiometer Suite or VIIRS onboard the NPP and NPOESS series of polar-orbiting operational satellites.
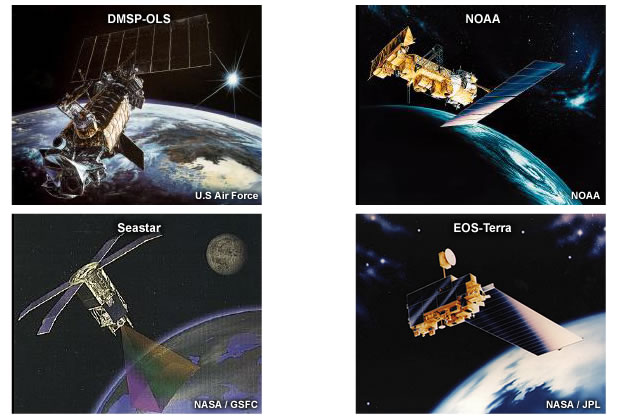
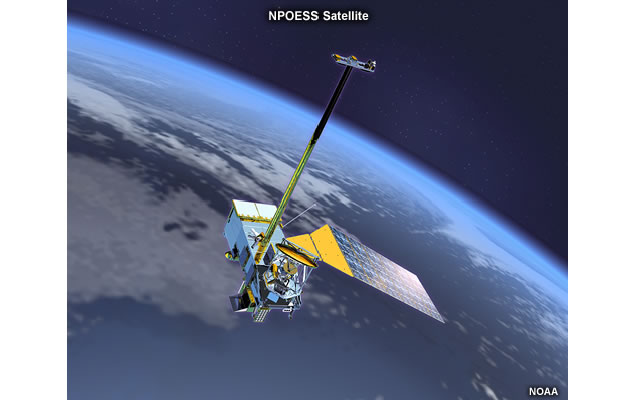
VIIRS represents the culmination of years of experience with both research and operational satellites. The concept came into being as the planned convergence of the capabilities of the Advanced Very High Resolution Radiometer (AVHRR) from the NOAA civilian operational satellites and the Operational Linescan System (OLS) from the Defense Meteorological Satellite Program (DMSP). In addition, VIIRS technology draws heavily from the Earth Observation System (EOS) Moderate Resolution Imaging Spectroradiometer (MODIS), a research instrument that is advancing our ability to observe and understand the earth and its atmosphere. VIIRS also owes a considerable debt to the SeaStar OrbView-2 Sea-viewing Wide Field-of-view Sensor (SeaWiFS). This is an ocean color imager that has given us vital new information about the oceans. While the initial motivation for a new imager came from AVHRR and OLS, the advanced engineering of VIIRS represents a synthesis of the architectures of MODIS and SeaWiFS.
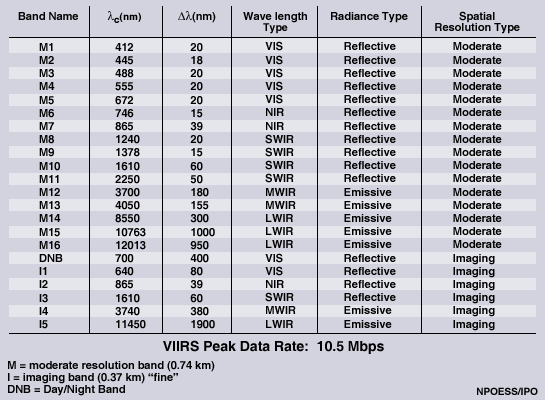
VIIRS has 22 channels meticulously chosen to produce a large array of Environmental Data Records or EDRs. Since we are considering imagery, spatial resolution is the key. The higher the resolution the better the imagery. VIIRS engineers are building an instrument that will maximize resolution.
This module will examine the strengths and the limitations of
VIIRS predecessor systems for two important reasons. First, the existing constellation
of polar-orbiting imagers is making important contributions to a much improved
imaging capability to come online with VIIRS. And second, for several years
to come, many of these existing satellites will continue to satisfy a huge number
of meteorological and environmental needs. The module will also devote important
attention to the OLS sensor since online educational materials about it are
not readily available elsewhere, and the OLS makes crucial contributions to
the sensor suite on VIIRS. Less emphasis will be placed on the AVHRR because
materials about it are available from existing COMET® Program distance learning
materials and elsewhere.
After completing the module, learners will be able to:
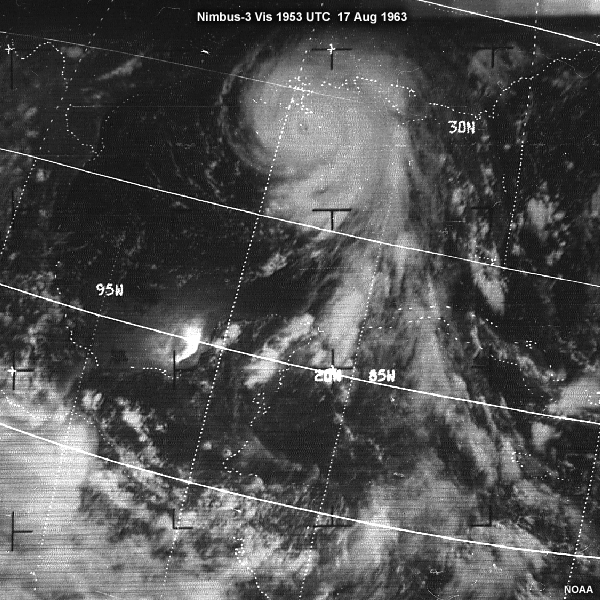
But what is "imagery" exactly? Imagery is used extensively
by "eyeball" meteorologists, as opposed to "numerical meteorologists."
Used for forecasting and nowcasting, it is in very high demand by the Department
of Defense in operations worldwide. It is also indispensable to the National
Weather Service, other operational agencies, and private businesses. Increasingly,
imagery goes well beyond what forecasters used to call "the satellite picture."
This was usually in black and white, visible and infrared, sometimes fuzzy in
appearance, and typically available hours later.
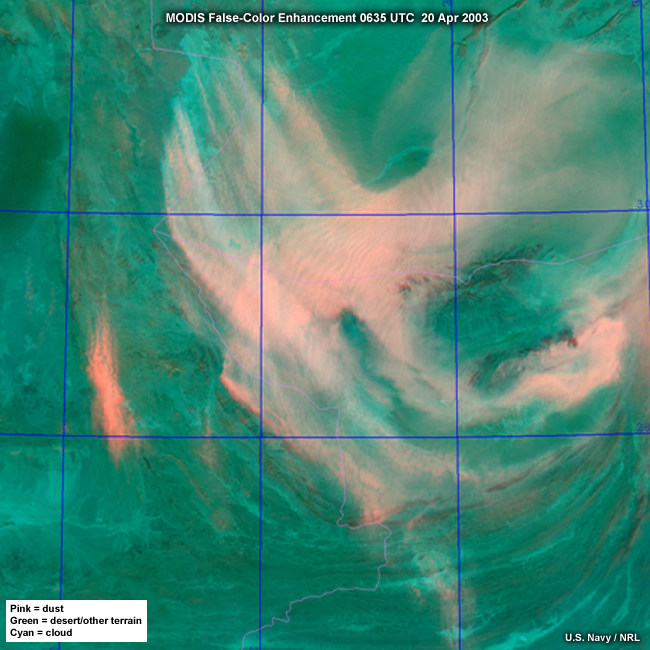
pink=dust, green=ground, cyan=cloud
The images from VIIRS will be sharp, colorful, information-rich depictions, available only minutes after overpass time. VIIRS will produce spectacular global composites as well as highly zoomed images over mesoscale and even microscale phenomena, like this zoom of a dust storm over western Afghanistan.
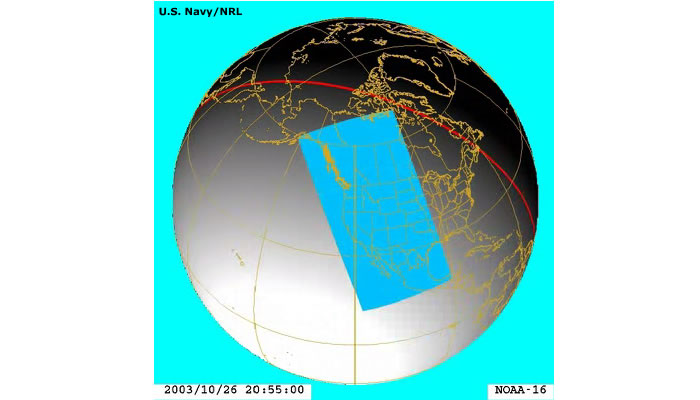
1.2 Polar-orbiting Satellite Coverage
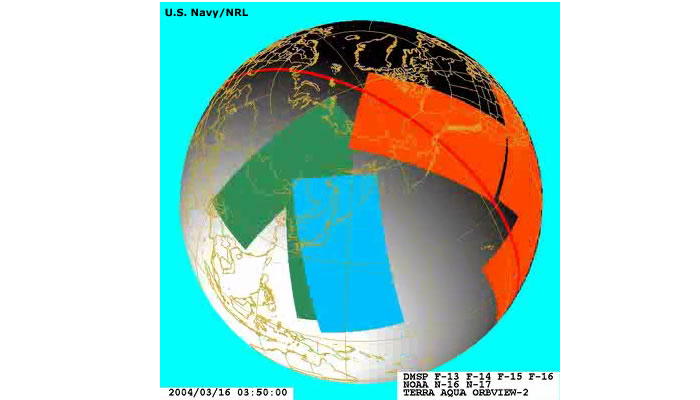
Polar-orbiting operational environmental satellites have been flying since the 1960s. As can be seen in this animation, they provide multiple “looks” at all areas of the globe every day. The following pages will show imagery from each of the currently operating polar satellite systems.
1.3 Southern California Fires: F15 OLS Nighttime Visible
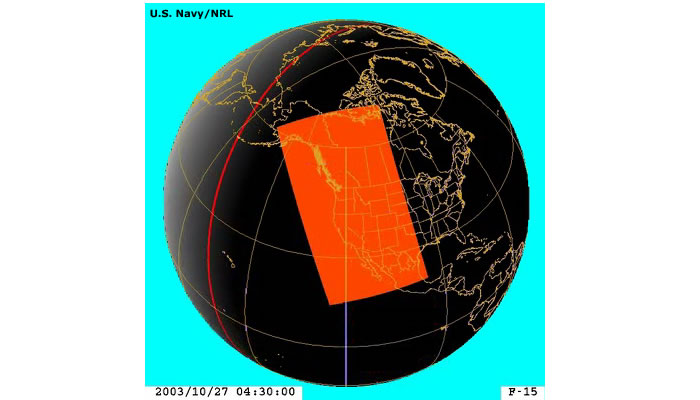
Here is the evening DMSP pass over the West Coast of the U.S.
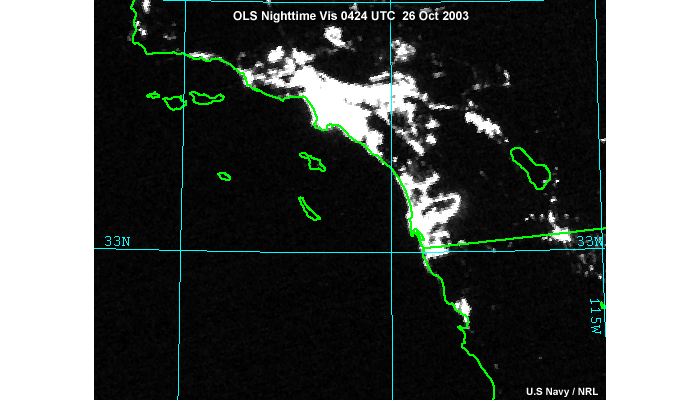
This OLS image was taken at about 9 PM local time showing what appeared to be the usual brilliant lights of the southern California coastal region. However, this was a night when wildfires raged out of control in the foothills north of Los Angeles to well south of the Mexican border. Don’t be surprised if you can’t see them. These fires are very bright but blend in perfectly with the bright city lights nearby.
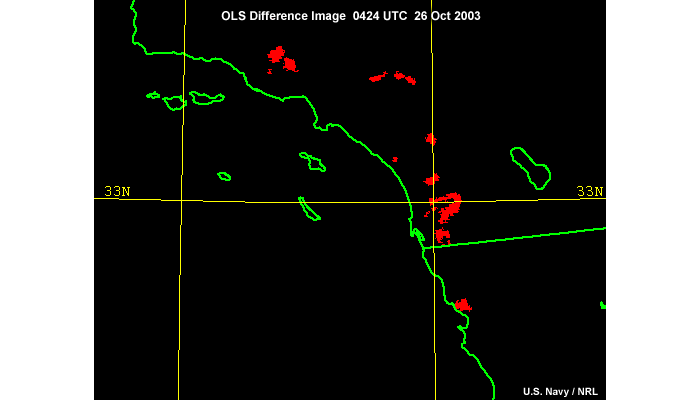
This new image is created by subtracting the first visible image from a fire-free background image taken a few nights earlier. This procedure isolates the fires in red and eliminates lights from cities.
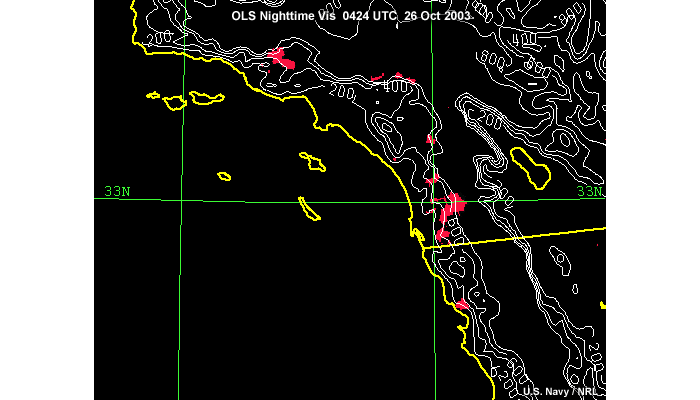
An overlay of elevation contours in white gives us the ability to track fires in areas of complex terrain. This capability will be much improved in the NPP/NPOESS era approaching later in this decade. These satellites will have the VIIRS sensor, which will have higher spatial and radiometric resolution, less noise, and more channels than DMSP. Fire images should be spectacular.
1.4 Southern California Fires: AVHRR
Let’s continue to monitor the progress of the emergency in Southern California, imaged the next day by the NOAA AVHRR aboard NOAA-16. This bird ascends during the daytime at about 2 PM local time.
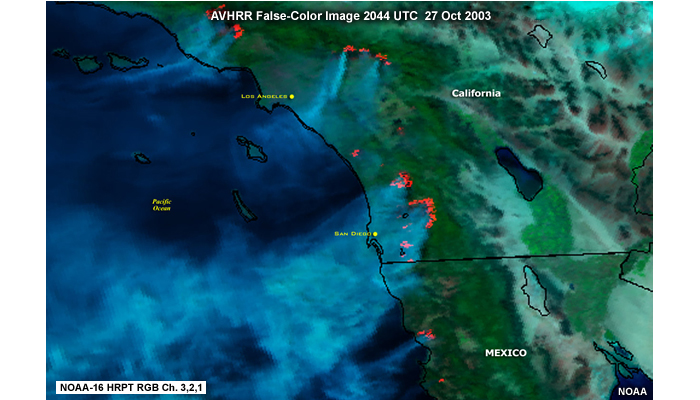
The image shows out-of-control chaparral fires fanned by hot Santa Ana winds. Red pixels represent fires in this false-color image. No wonder the fire imaging capability of AVHRR has been such a hit. Emergency managers use these images in near real time to coordinate fire fighting efforts.
1.5 Southern California Fire: MODIS
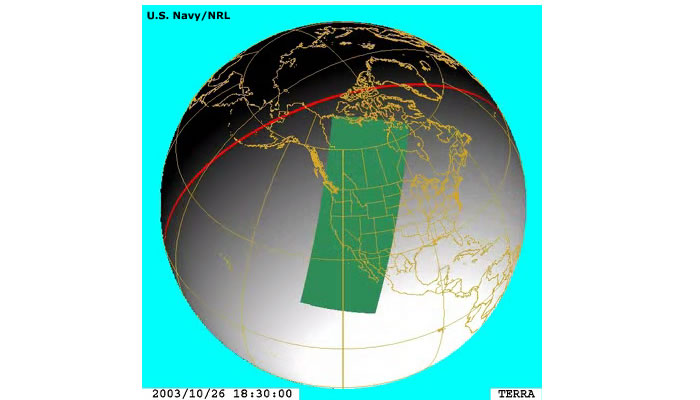
Now look at the improvement possible with the EOS-Terra MODIS imager, which passes over the same area at about the same time.
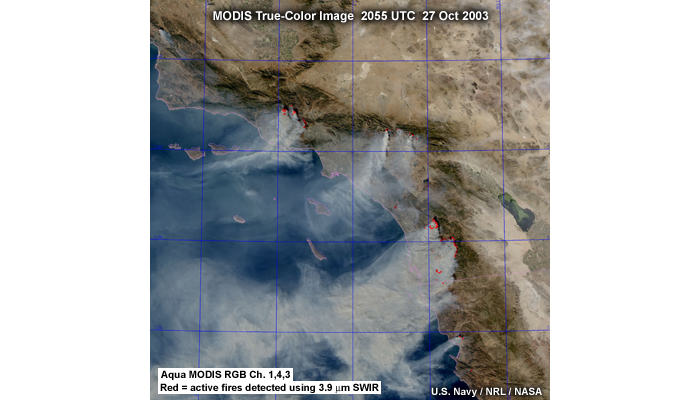
Shown here is a true-color image. Notice that the advanced MODIS capabilities give us sharper detail, more realism, and the ability to see right through the smoke. Fires in red are annotated on top.
1.6 Southern California Fires: MODIS Zoom
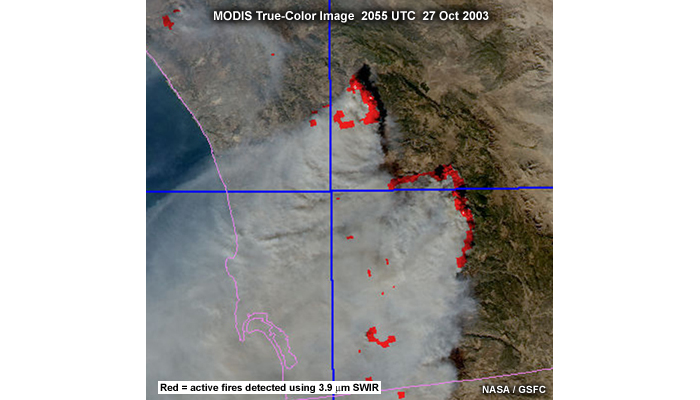
NPOESS VIIRS will bring even further improvement. First, images like this one will typically be available to fire monitoring facilities within 15 minutes from overpass time, much faster than with current satellites. Second, depiction of fires, shown in red, will be better in the VIIRS era. Notice the “blockiness” of the fires in this zoom of the previous MODIS image. VIIRS will have an improved fire channel footprint size seven times smaller in area than that of AVHRR or MODIS. Due to the unique properties of the fire channel, it may be possible in the VIIRS era to see individual shrubs which have ignited in advance of the main fire.
1.7 Using MODIS/VIIRS for Burn Scar Identification
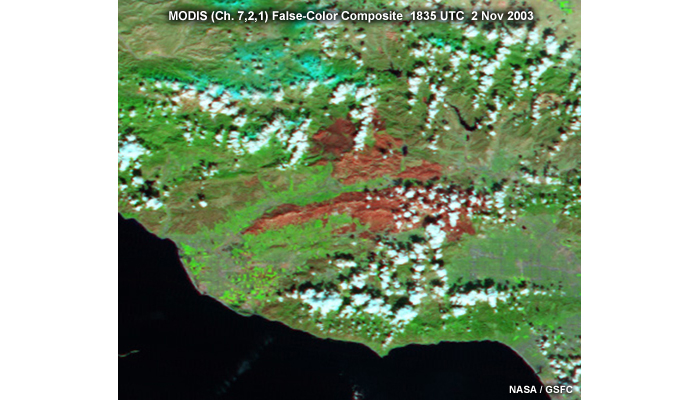
Not only will VIIRS help us see fires. It will also give a detailed look at the burn scars that follow, helping in the rebuilding and restoration phase. Here MODIS gives a preview of this capability several days after brush fires. Burn scars are shown in red northwest of the San Fernando Valley near Los Angeles.
2.0 VIIRS Resolution Improvements
2.1 MODIS: Three Spatial Resolutions
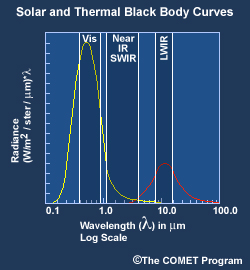
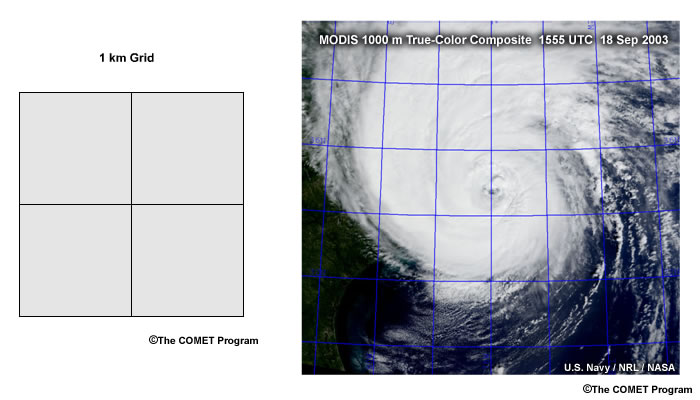
The NASA-EOS MODIS instrument provides an important preview of the high spatial resolution capabilities of NPOESS VIIRS. MODIS has 29 channels at 1000 m resolution from the visible through the longwave infrared.
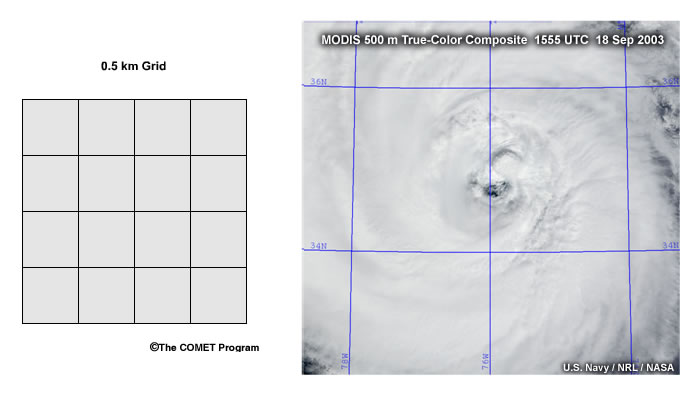
It also has five channels at 500 m resolution extending from the visible to the shortwave infrared.
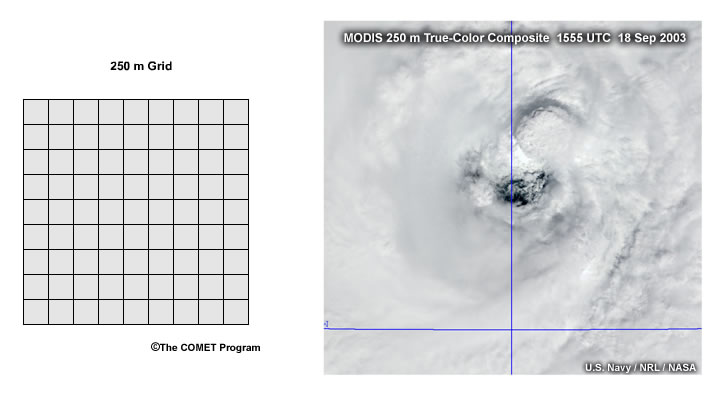
Finally, the instrument has two channels at 250 m resolution,
one visible and one near-infrared.
At 250 m, we can zoom in on the spectacular detail at the center of Hurricane
Isabel.
Except for the Day/Night channel, the VIIRS and MODIS channels are similar.
There will be some modifications of the exact wavelength ranges used on VIIRS,
but if you like the colorful high-resolution products from MODIS, you'll love
VIIRS.
2.1a VIIRS Radiometric
Performance
(Click the image for
a scalable PDF version.)

VIIRS is being build by Raytheon Santa Barbara Remote Sensing. The many details of VIIRS engineering and data flow are beyond the scope of this module. The focus here is much more on VIIRS imagery and products.
2.2 VIIRS: Two Spatial Resolutions
The 22 imaging channels of VIIRS are divided into two spatial
resolutions, fine and smooth.
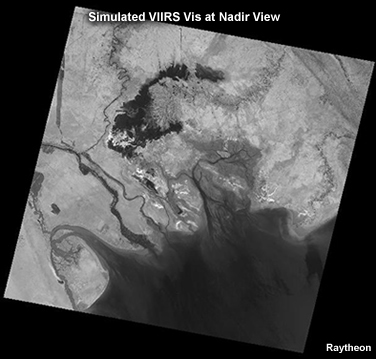
Here is a simulation of the VIIRS visible fine channel at a high spatial resolution of about 0.37 km based on a NASA Landsat image.
These channels were chosen as "fine," having proven themselves on the AVHRR and other sensors. The fine channels are scattered through the visible and infrared wavelengths. Spectral diversity at high spatial resolution enhances the applicability of VIIRS measurements.
The VIIRS moderate resolution channels, while lower in resolution, complement the fine resolution channels. Here is a simulation image based on Landsat for the visible wavelength.
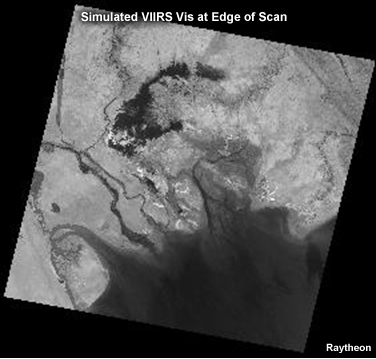
At nadir, the resolution is 0.74 kilometers. Many of these channels
were drawn from MODIS and SeaWiFS.
At a spatial resolution of 0.74 km, the Day/Night channel belongs in a separate
category that will be discussed later.
2.2a Excellent Overall EDR-Driven Performance
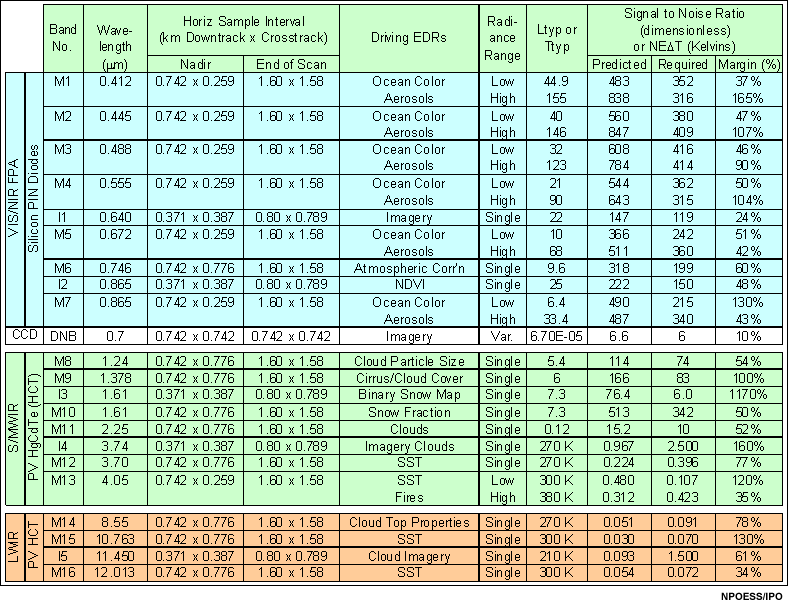
VIIRS has 22 carefully selected channels to produce the environmental data records (EDRs) listed here. VIIRS has three kinds of channels: “I” or imager resolution channels at high resolution, “M” or moderate resolution channels at a lower resolution, and a Day/Night channel in a category all by itself.
2.3 Satellite Resolution Grids
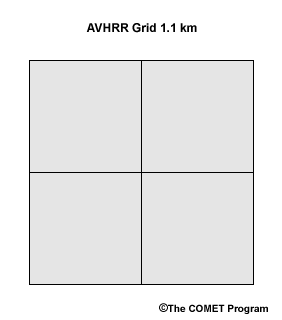
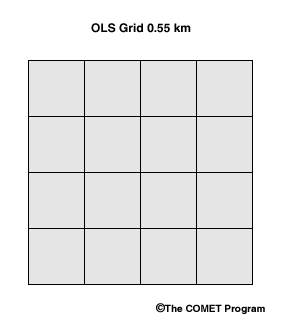
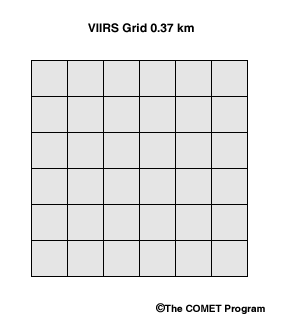
Let's examine the highest resolution possible with AVHRR, OLS, and VIIRS, and compare the three. This sequence of grids illustrates the improvement at nadir. But as we will see, this is a significant underestimate of the total improvement that will come with VIIRS.
2.4 AVHRR Contributions to VIIRS Spectral and Spatial Resolution
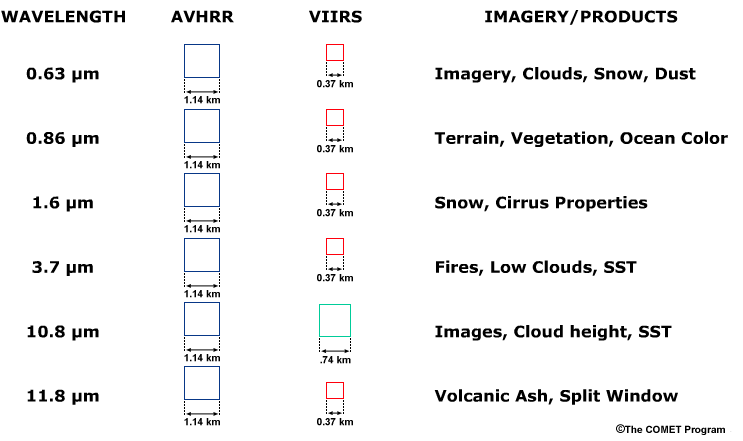
All of the six spectral channels on AVHRR will be included on
VIIRS at a much higher spatial resolution. The smaller the squares, the higher
the resolution and the more detailed the images. Five of the AVHRR channels
will become VIIRS fine channels at about 0.37 km. A sixth channel will become
a moderate resolution channel. VIIRS channels shown here have also flown on
GOES, facilitating algorithm transition.
The AVHRR provides not only high spatial resolution, but fine calibration which
is crucial for certain kinds of imagery. VIIRS radiometric resolution will improve,
with 4096 grey shades or levels of independent measurement vs. only 1024 for
AVHRR. This will lead to more useful image products and better science. Many
products will be available at much higher spatial resolution than with AVHRR,
including fires, nighttime fog, snow cover, and many more.
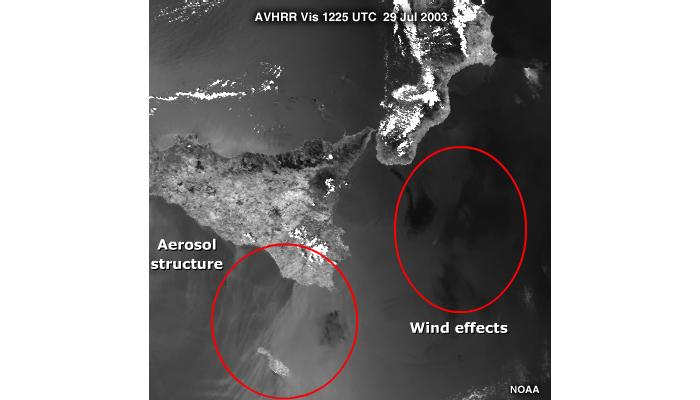
An AVHRR pass over the Mediterranean demonstrates the high-resolution capabilities of this sensor. This AVHRR visible zoom shows tremendous detail over Sicily and the Mediterranean. The image’s 1024 available grey shades help reveal aerosol structure and differences in ocean roughness due to surfacewinds.
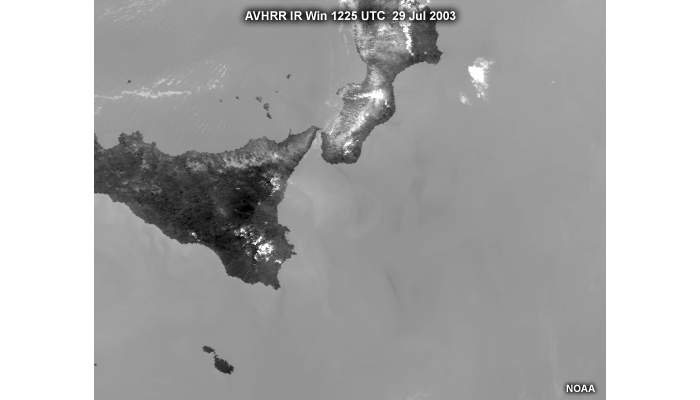
The corresponding infrared zoom has the same high spatial resolution available in the visible.
2.6 Advances in Sea Surface Temperature
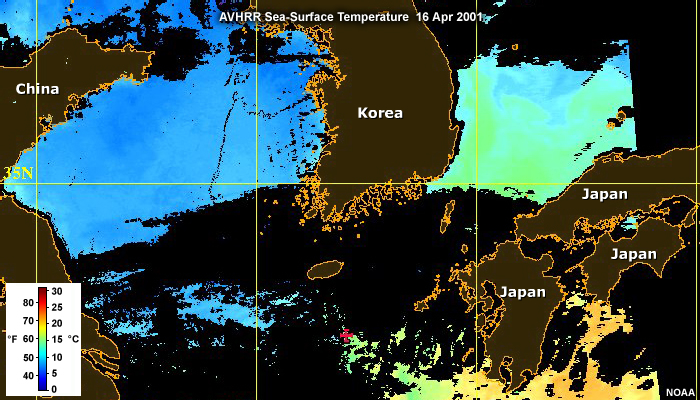
One of the top requirements for the NPOESS satellite is retrieval
of sea surface temperature. There are few environmental variables more important
for climate, weather forecasting, recreation, and the ocean environment. AVHRR
has been performing this mission for decades on both regional and global scales
with accuracies on the order of one half degree Celsius.
There are two main tasks in the production of sea surface temperature. First,
cloud-free areas must be identified since the infrared channels cannot detect
the sea surface through clouds. And second, several infrared channels are combined
to derive sea surface temperature in the cloud-free areas.
In this image the coolest waters are west of Korea in blue. To the east of the
Korean peninsula waters are somewhat warmer and shown in green. Warmer still
are the waters south of Japan shown in orange. The problem is that so many regions
are blacked out due to cloud contamination that the sense of spatial continuity
is lost.
Fortunately, in the NPOESS era the Conical Microwave Imager Sounder (CMIS) will
serve as a companion to VIIRS. CMIS will fill in the sea surface temperatures
where clouds block the VIIRS infrared channels, eliminating the troublesome
gaps.
3.1 OLS Direct Readout: Fine vs. Smooth Mode
Looking at OLS operating in direct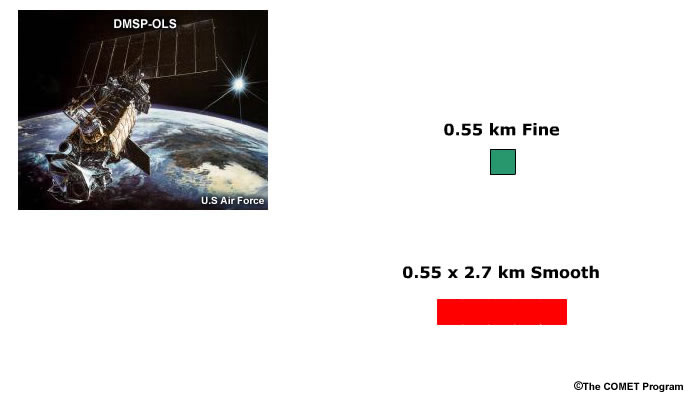 readout mode can reveal some important aspects of the spatial resolution in
the data. The satellite sends data to the earth in one of two modes, either
fine/high spatial resolution mode at about one-half kilometer, or smooth/low
spatial resolution mode. Only one channel, visible or longwave infrared, is
sent in fine mode in order to conserve transmission bandwidth. To produce smooth
pixels, onboard processing averages five pixels in a row to make long rectangles.
These smooth pixels have the same dimension as the fine in the along-track direction,
but appear stretched by a factor of five in the along-scan direction.
readout mode can reveal some important aspects of the spatial resolution in
the data. The satellite sends data to the earth in one of two modes, either
fine/high spatial resolution mode at about one-half kilometer, or smooth/low
spatial resolution mode. Only one channel, visible or longwave infrared, is
sent in fine mode in order to conserve transmission bandwidth. To produce smooth
pixels, onboard processing averages five pixels in a row to make long rectangles.
These smooth pixels have the same dimension as the fine in the along-track direction,
but appear stretched by a factor of five in the along-scan direction.
3.2 OLS Direct Readout: Fine Mode
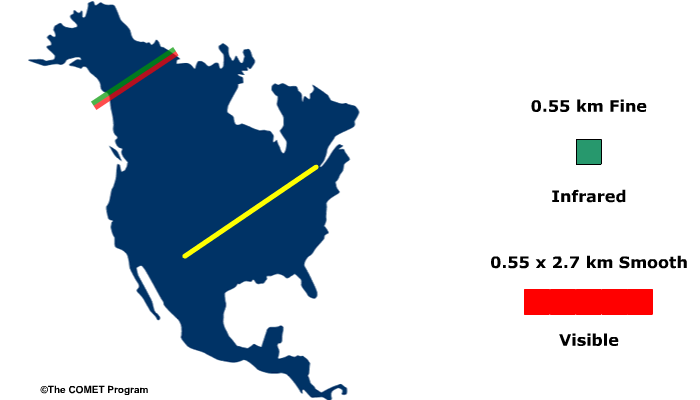
The choice of fine vs. smooth can change depending on how the satellite is programmed. For a particular location, the satellite might be ordered to transmit the infrared as fine and the visible as smooth. In that case, analysts viewing the data would see high-resolution "fine mode" infrared images, but "smooth" resolution visible images.
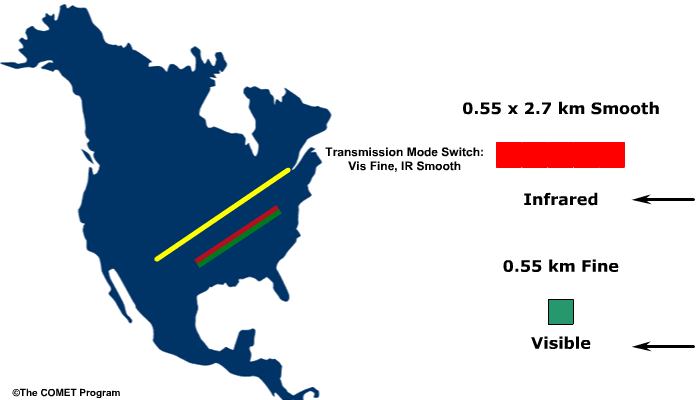
The choice of "fine" and "smooth" is up to central planners trying to maximize the effectiveness of the data stream at any one place.
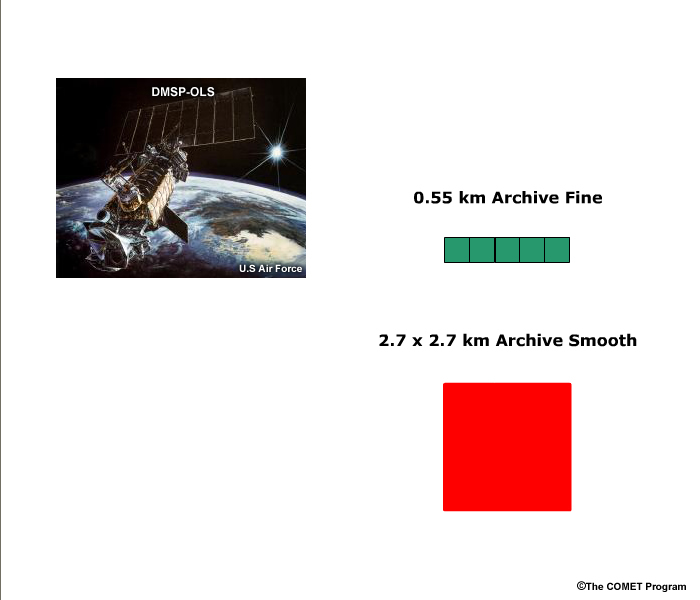
There is a second kind of DMSP OLS data configuration that is stored on the satellite rather than transmitted in real time to ground stations. This second mode is later transmitted to the Air Force Weather Agency (AFWA) in Omaha, Nebraska and archived at the National Geophysical Data Center (NGDC) in Boulder, Colorado. The fine resolution is the same as before. But unlike the direct readout, the smooth is degraded in both along- and cross-track dimensions, resulting in even smoother images.
3.3 OLS Smooth and Fine Data over the Mediterranean
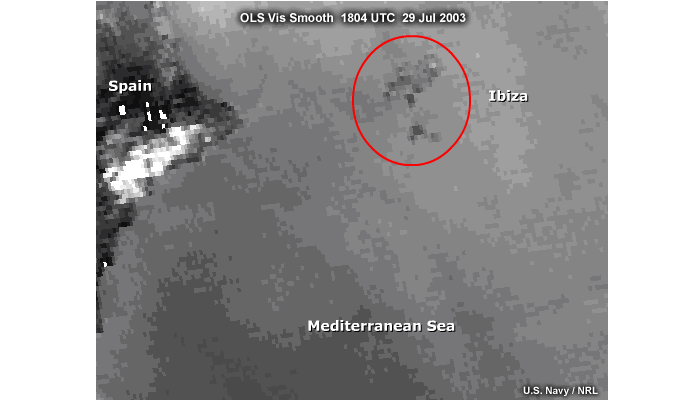
Here is an example illustrating the difference between smooth and fine imagery. Look at the zoom of the east coast of Spain and the Mediterranean with OLS IR in smooth mode. The image at 2.7 km resolution is so coarse that it's almost impossible to distinguish the island from the surrounding sea surface. You can see individual pixels.
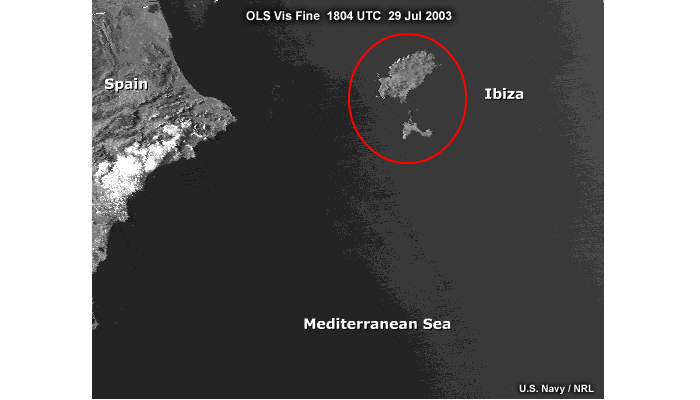
But now let's switch to the visible fine mode image at 0.55
km resolution. Notice how much sharper the detail is.
But there is a disadvantage in the visible fine data. In order to transmit the
large amount of data required to produce high-resolution imagery, the system
economizes by sending the information in only 64 levels of grey. This reduction
in the number of available grey shades causes features of relatively uniform
brightness to appear as one shade of grey. For example, notice that the water
off the coast appears in only three shades of grey. This limitation of the OLS
will be replaced by a much improved capability in the VIIRS era. Instead of
only 64 available grey shades, VIIRS will have an astounding 4096 grey shades
to display.
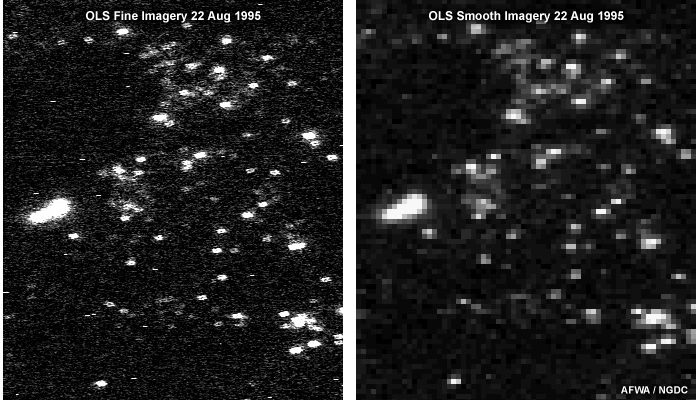
The distinction between fine and smooth imagery that we discussed earlier also appears in the nighttime visible channel. Here, for example, is a comparison between the appearance of cities in a fine vs. a smooth image. The same light sources can be seen in both. But in the smooth data it's difficult to distinguish individual cities. In the VIIRS era there will be another level of improvement beyond what is shown on the left side.
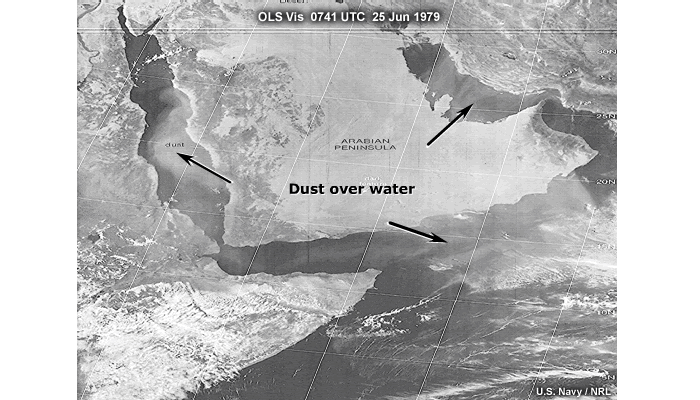
Now let’s pretend that a time machine has whisked us back to the year 1979, before many of today’s young weather forecasters and scientists were born. A severe dust outbreak originating over the Arabian Peninsula extends to water bodies on three sides, as seen by this OLS visible image. Used as a training example in one of the first manuals to describe suspended and blowing dust from a space observation perspective, it does an excellent job of showing dust over water. But because dust tends to blend in with the desert background, you might think that there is no dust over land.
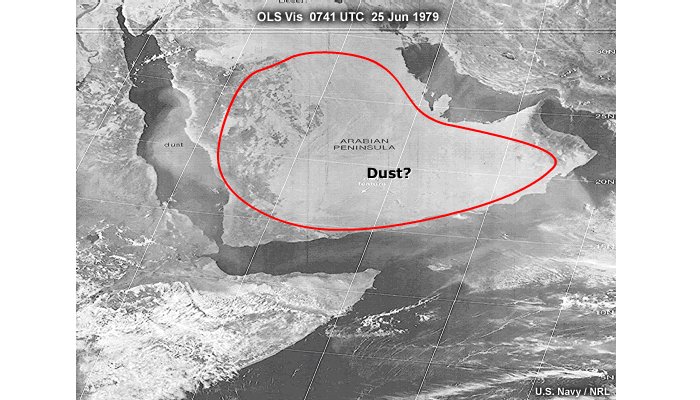
On the contrary, over Saudi Arabia we are looking right through thick dust, but just don’t know it!
3.5 MODIS Dust Product with COAMPSTM Model Winds
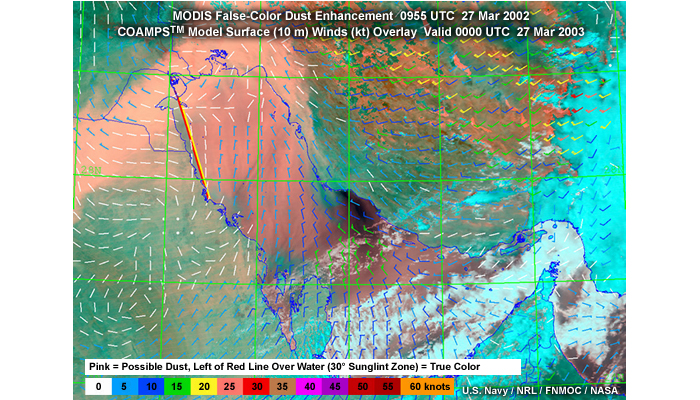
Coming back to the present, an EOS-Aqua overpass hints at the VIIRS capability in this multispectral view from the onboard MODIS sensor. Here we are able to see suspended and blowing dust over both land and sea. Thick dust is pink. Mesoscale winds from a short-term forecast add additional information. Notice, for example, that northerly winds over the Persian Gulf are transporting the dust well south of the source region.
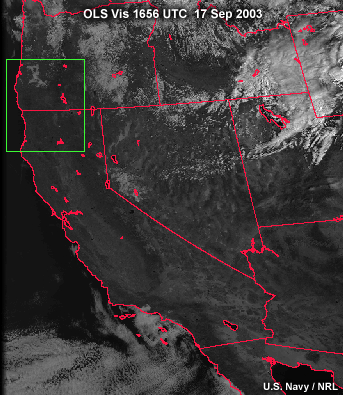
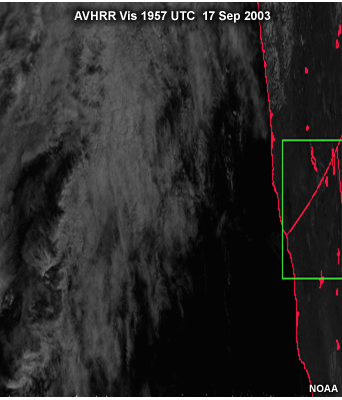
Before we can complete our understanding of NPOESS VIIRS, we need to revisit the DMSP OLS, which has an intriguing feature unique among weather satellites. Shown here are two visible images, one from OLS fine taken over the Pacific Ocean and the other from NOAA AVHRR taken over the western United Sates. Notice that the images overlap slightly over the northwestern United States. Both data sets are often called high-resolution, which is for the most part an accurate assessment, but something fascinating happens at the edge of scan as we'll see.
4.2 OLS and AVHRR at Edge of Scan
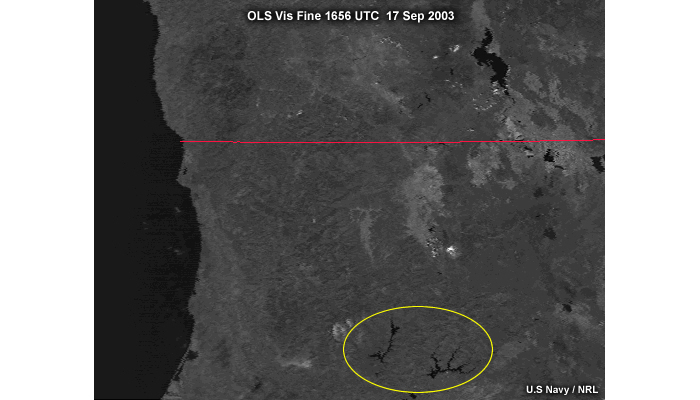
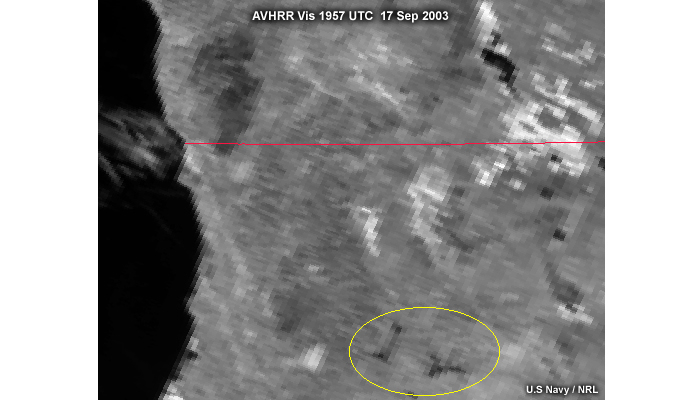
Compare these two co-registered zooms from each of the passes in the region of overlap. Notice how the OLS image retains its sharpness at the edge while the AVHRR pixels become very fuzzy. Look for example, at the level of detail of the reservoirs in the southern portion of the image.
4.3 Dramatic Spatial Resolution and Sampling Improvements
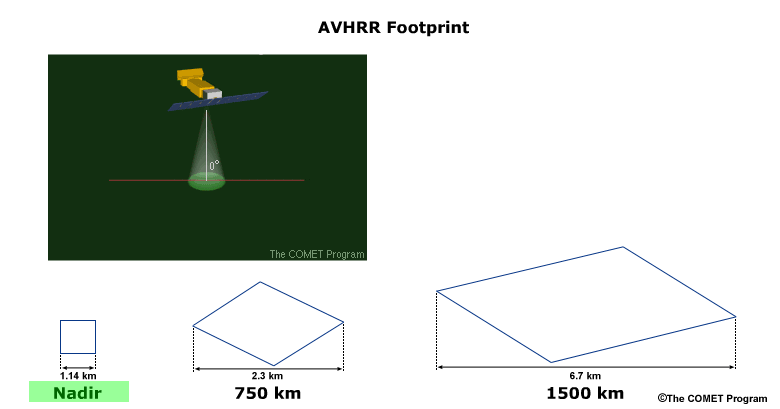
Image quality is a function of the satellite scanning strategy. The following graphics depict individual footprints from several satellites beginning with a nadir view,
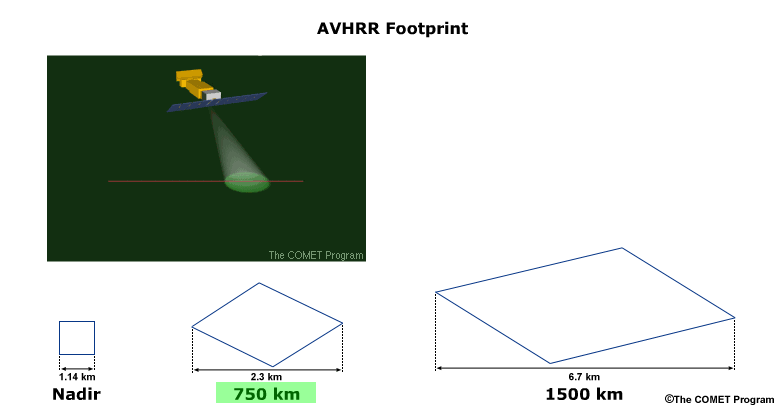
then halfway out toward the edge of scan,
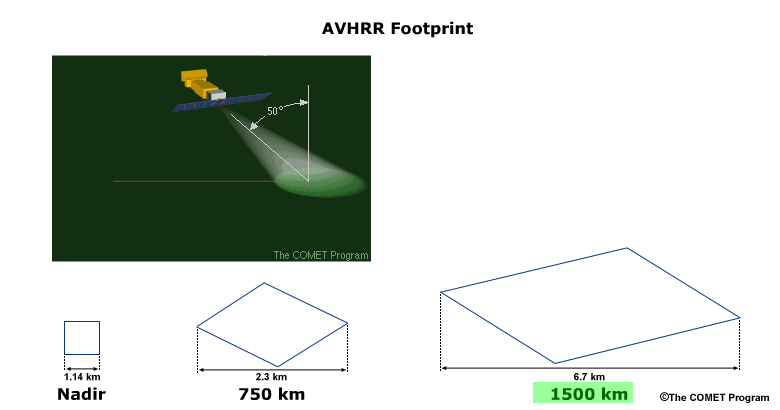
and finally at the edge of scan.
For AVHRR, high-resolution footprints at nadir degrade rapidly to low-resolution data toward the limb. The growth in pixel size is huge. No wonder the AVHRR images we looked at were so degraded. MODIS and SeaWiFS imagery have the same degradation factor as AVHRR.
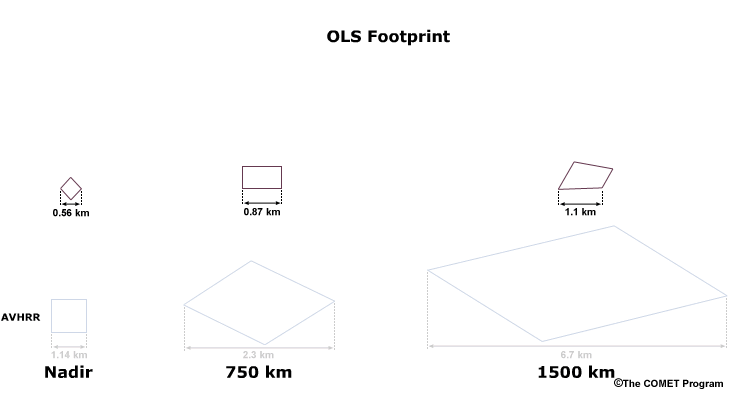
The OLS engineering produces a much smaller degradation toward the edge of scan, and hence, the pixels are still high resolution and details in the image are preserved.
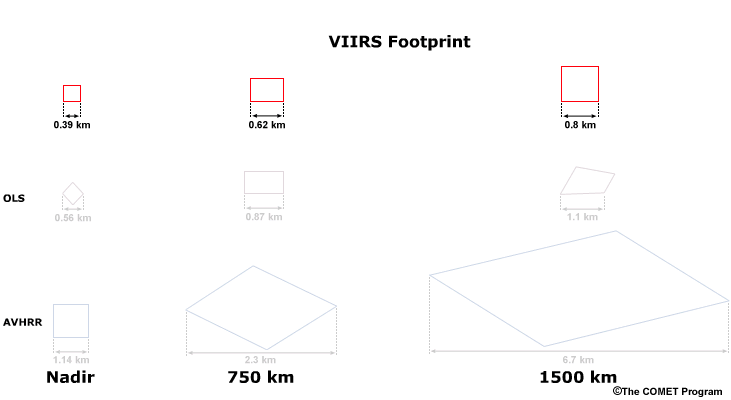
The advanced VIIRS engineering borrows this concept from OLS to avoid the pixel growth inherent in AVHRR, MODIS, and SeaWiFS. Notice the minimal growth of the fine resolution VIIRS channels. VIIRS will preserve image quality across the scan.
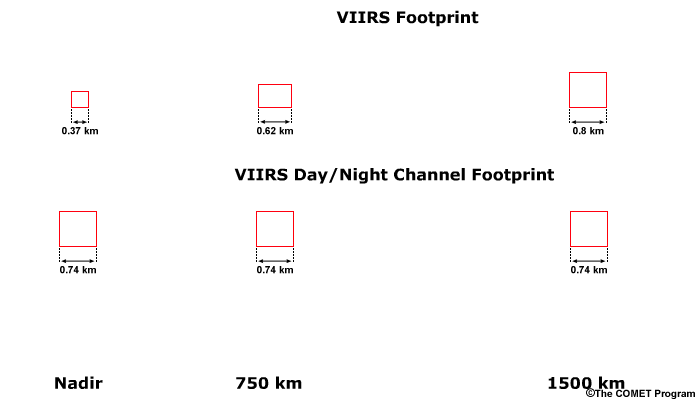
Finally, let’s consider the VIIRS Day/Night channel. It does not expand at all! This is one of several reasons that nighttime visible images from VIIRS will be superior to the current DMSP OLS.
4.4 OLS and AVHRR at Edge of Scan over Hawaii
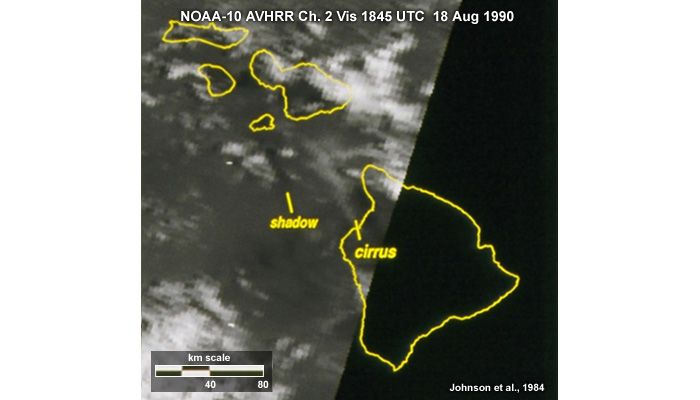
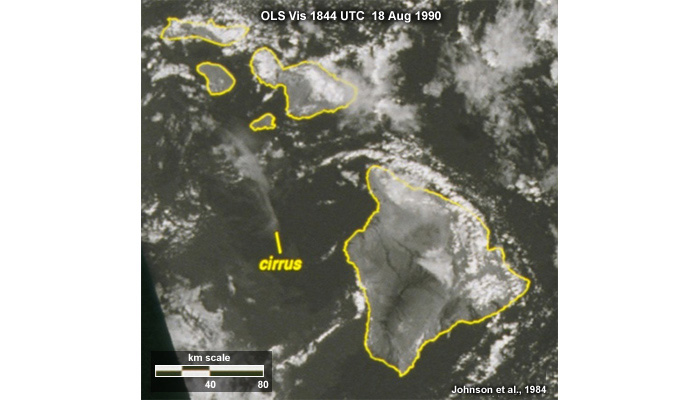
Let’s look at another pair of examples imaged moments apart. The OLS visible image has sharp cloud detail at the edge of scan, whereas the AVHRR edge-of-scan image shows cloud features that are blurred. Clearly, the OLS has a huge advantage in these regions.
4.5 Pixel Growth at Edge of Scan
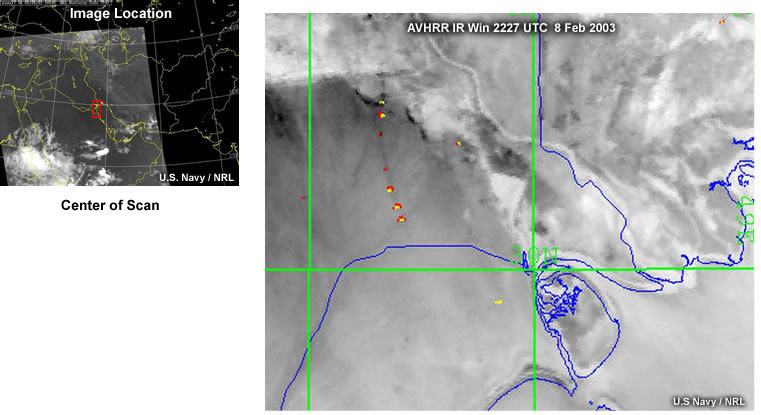
The growth of pixels at the edge of scan for imagers like AVHRR and MODIS can have a profound effect on derived products, not just on simple single-channel imagery. Let’s look, for example, at this case of nighttime gas flare detection over Kuwait using the AVHRR. The hot flares, that are at the center of the scan, are shown in red.
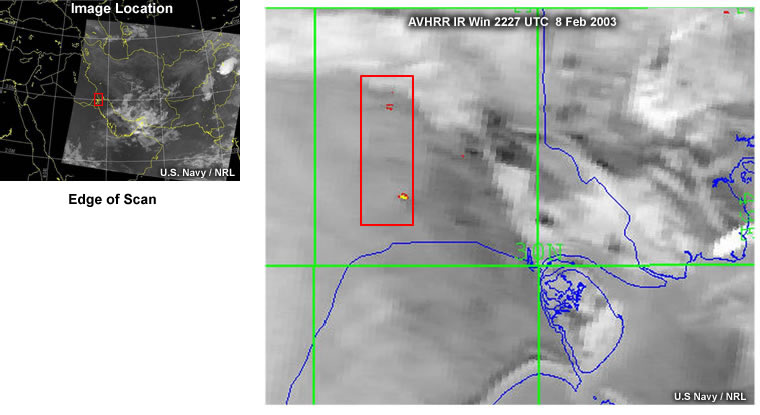
But on a night with the same set of gas flares burning, significantly fewer flares are detected toward the edge of scan. Don’t get the false impression that the gas flares are being turned on and off based on successive images. Seeing fewer flares or hot spots in this case is mostly the result of edge-of-scan effects so that smaller, less intense flares can no longer be resolved.
4.6 AVHRR and VIIRS Visible Simulations
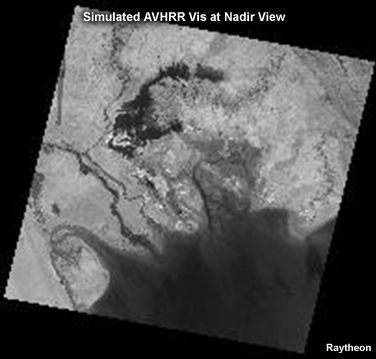
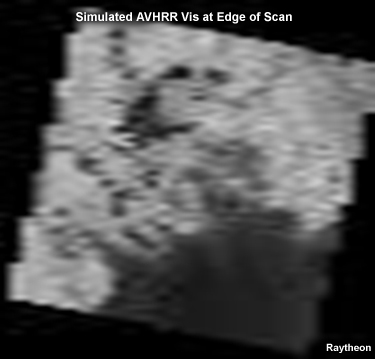
We can’t show any examples of the improvement in scan geometry from VIIRS, but we can show simulations based on what VIIRS will probably look like compared to AVHRR. Based on very high-resolution Landsat data, these visible images simulate the appearance of the northern Persian Gulf in a nadir versus edge-of-scan view for AVHRR. Notice how the edge-of-scan view becomes almost completely useless, especially if an analyst wanted to examine the intricate waterways within this region.
Here we look at the kind of improvement expected in the VIIRS era. A sharp eye can still spot minor degradation from nadir to edge of scan. But to many users, the images here will look identical. For example, both images are almost equally good at examining the delta region. Therefore, users wanting detail will not have to toss out VIIRS passes simply because their area of interest lies near the edge of the pass. Image quality will be high everywhere.
5.0 True-color Imagery with VIIRS
5.1 Introduction: SeaWiFS and MODIS Contributions
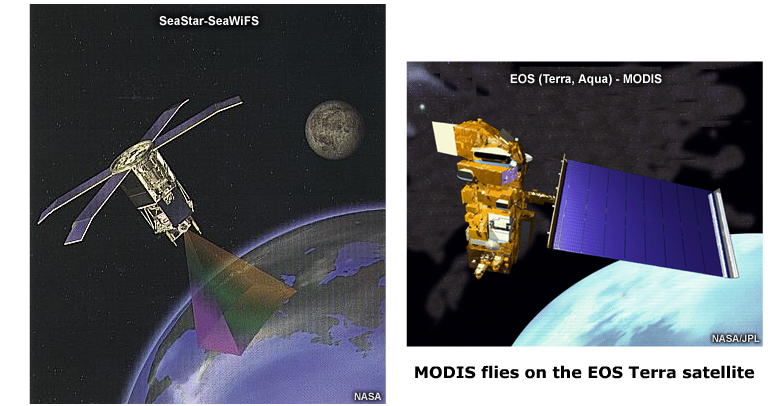
Let's examine the contributions of SeaWiFS and MODIS. These two systems have accomplished two major tasks in preparation for VIIRS. First, components of the engineering from each have been combined to form the advanced VIIRS architecture. And second, each has multispectral channel suites crucial for the construction of advanced imagery. In the case of SeaWiFS, the imager has been used to produce ocean color and aerosol products while MODIS has been used to demonstrate atmospheric, ocean, and land-use products.
Color will add an important dimension to VIIRS imagery. Using MODIS and SeaWiFS, we can examine some of the ways color can enhance the usefulness of image products.
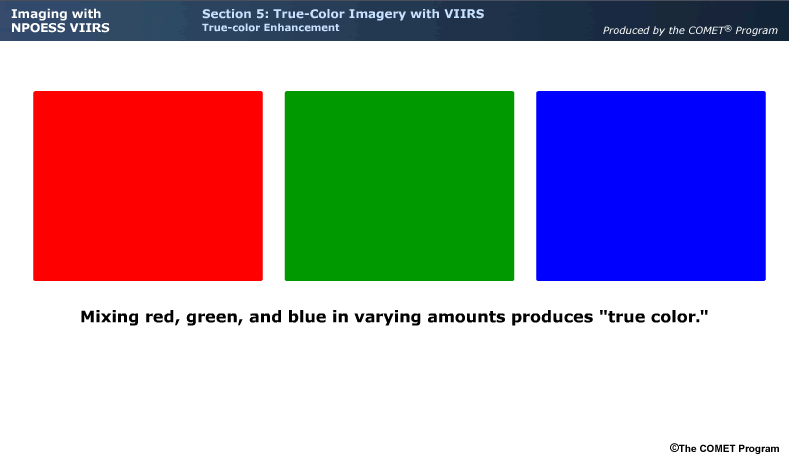
True-color imagery mimics what the human eye can see and is formed by combining colors as the diagram shows here. Individual visible channels are traditionally displayed as black and white imagery.
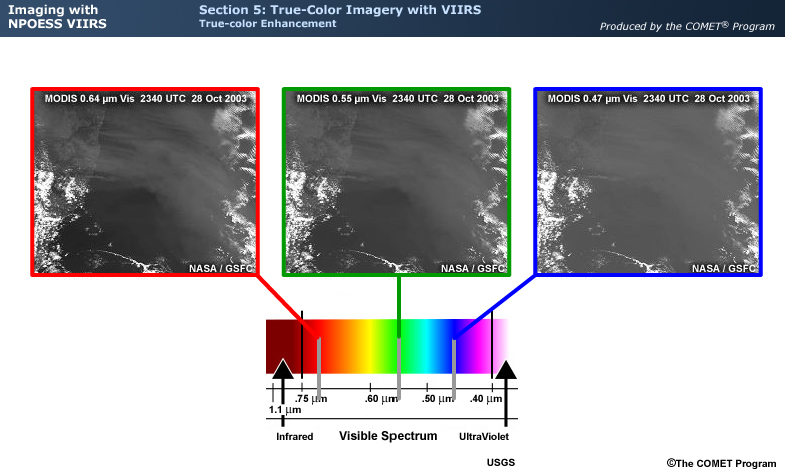
The reflected light shown in a visible image, however, represents a distinct portion of the visible spectrum ranging from the shorter (blue) wavelengths to the longer (red) wavelengths. The MODIS imager, like VIIRS, has three visible channels that correspond closely to the red, green, and blue wavelengths within the visible spectrum.
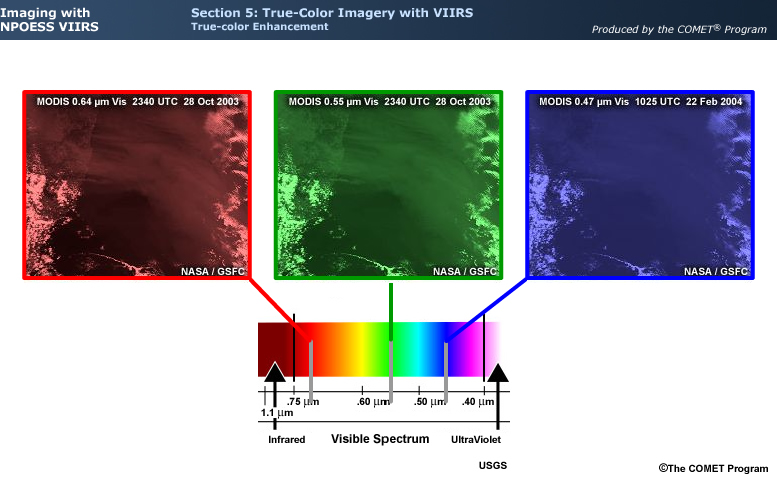
Each of these channels can be processed so that one color range is assigned to each of the three wavelength regions. Combining all the color ranges produces what is known as "true-color" imagery.
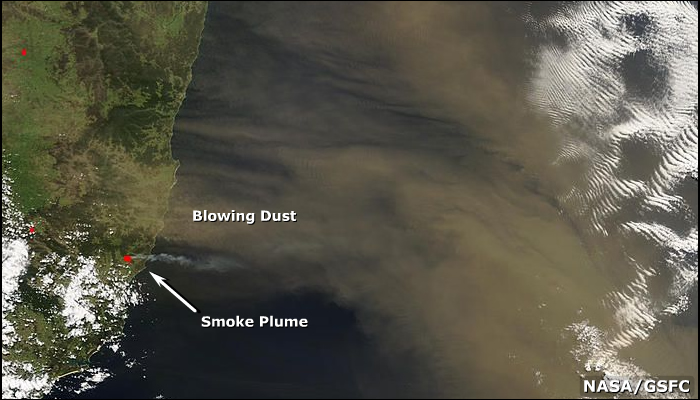
The first example shown here is of blowing dust and smoke being advected eastward off the east coast of Australia. Notice how much easier it is to distinguish the smoke plume from the large area of blowing dust in the true-color image. The suspended dust particles take on a light brownish appearance in the true-color composite because they reflect more light at the longer visible wavelengths, the red and green regions of the spectrum. Smoke from burning vegetation, on the other hand, appears relatively white, reflecting the red, green, and blue components of visible light in relatively equal amounts. Recall that when you combine red, green, and blue in equal amounts, the result is white. Clouds are also easily separated from the suspended dust in the true-color image, and appear white for much the same reason. A small group of red pixels indicating hot spots or fires appears at the western end of the smoke plume. These were inserted after the channel compositing took place using information from the thermally sensitive shortwave infrared channels on MODIS.
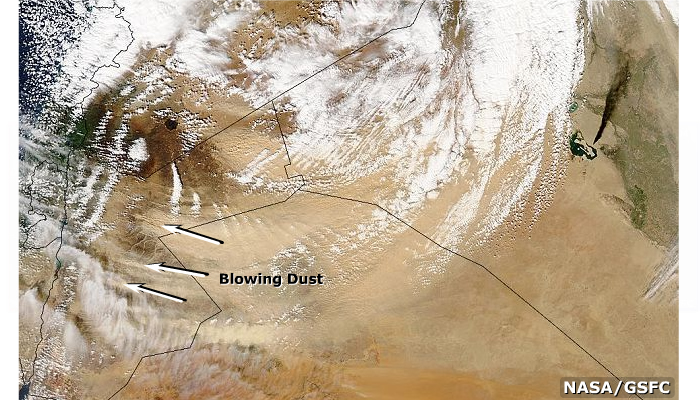
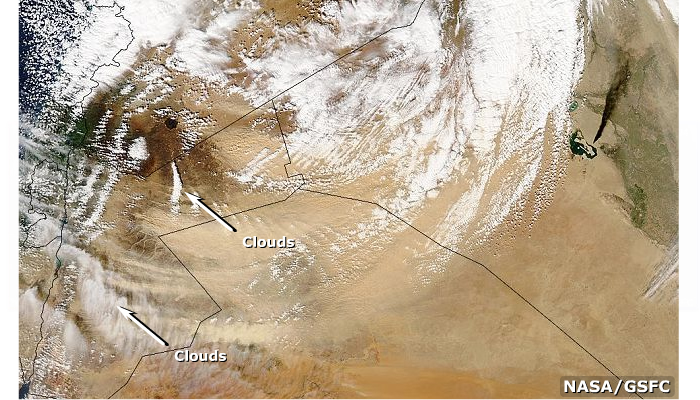
The second example highlights a dust storm over Jordon, Iraq, Saudi Arabia, and an oil fire in Iraq. Notice how effectively the true-color image distinguishes blowing dust and clouds when compared to the same scene in the single-channel black and white images.
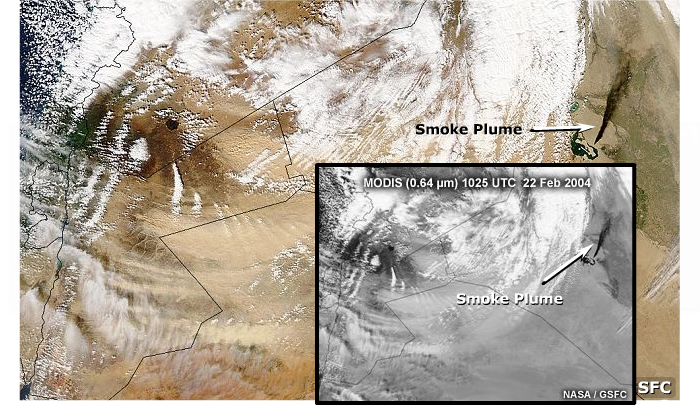
The smoke plume associated with an oil fire in Iraq appears black in both single-channel visible and true-color imagery, since oil smoke is very effective at absorbing light across the visible spectrum.
5.3 Polar Eddies in the Davis Strait
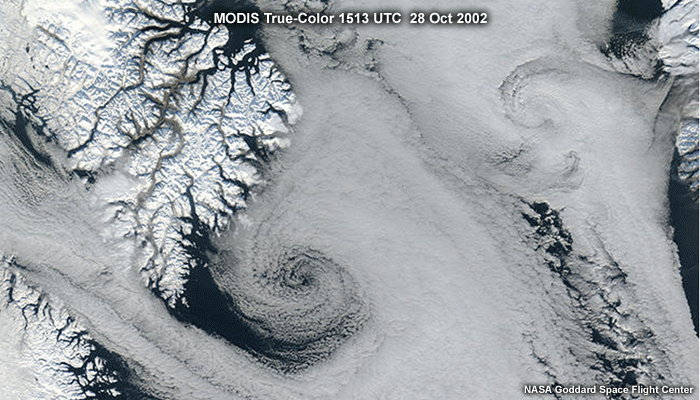
Using a MODIS true-color image we can examine some polar eddies in the Davis Strait between Greenland and Canada. These eddies are often the first stages in polar low development and can be shown in great detail using MODIS true-color imagery. Improved communication speeds in the NPOESS VIIRS era will mean that these features can be imaged and tracked in real time, giving polar forecasters a valuable boost in productivity.
5.4 Hurricane Isabel
at Different Resolutions: GOES Imager
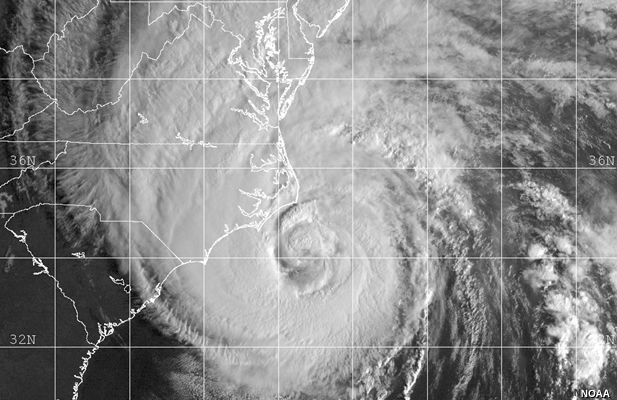
For an example of what VIIRS offers in terms of improved spatial resolution, let’s first look Hurricane Isabel with some GOES imagery. The images are in black and white since true color is not available with GOES. The highest possible resolution from GOES is with the 1-kilometer visible channel as Isabel makes landfall in North Carolina. The loop gives you a penetrating view of the storm, but what if you want to go in even closer?
5.5 Hurricane Isabel at Different Resolutions: AVHRR
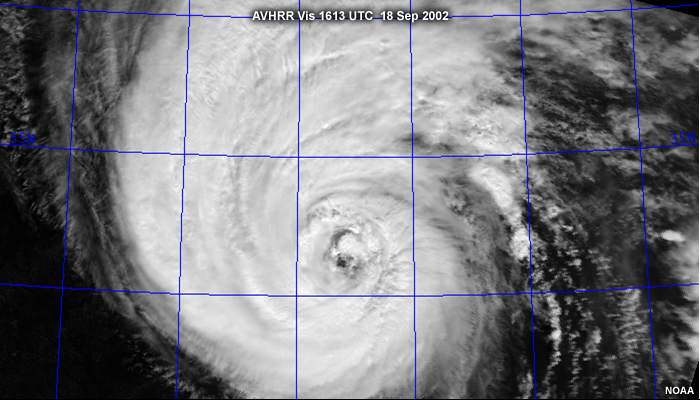
The NOAA AVHRR sensor also provides detailed images, but still the maximum resolution is limited to about 1 kilometer. Like GOES, the sensor is incapable of true-color imaging. What can we do if we really want to see inside the eye of the storm?
5.6 Hurricane Isabel at Different Resolutions: MODIS and VIIRS
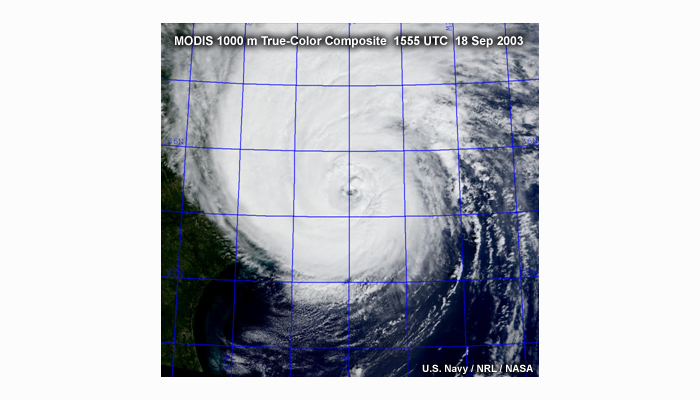
As the EOS Terra satellite flies over the storm we get a preview of VIIRS true-color capability. Let’s start with a 1-kilometer view similar to what we saw from GOES and AVHRR.
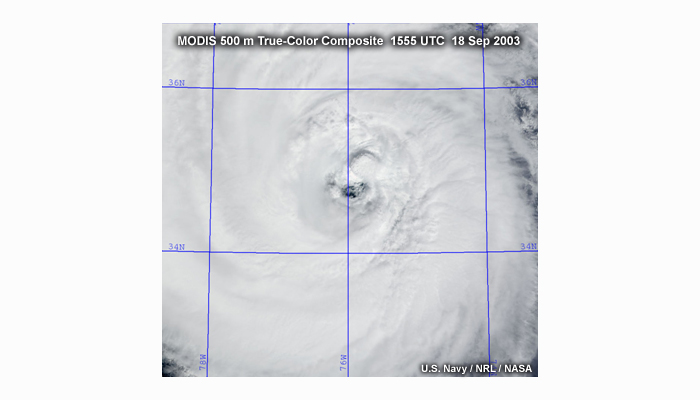
Now let’s go to a 500-meter view, comparable to the fine visible channel of the DMSP OLS. For many years, this was by far the highest spatial resolution you could get from a weather satellite. But now we can exceed it.
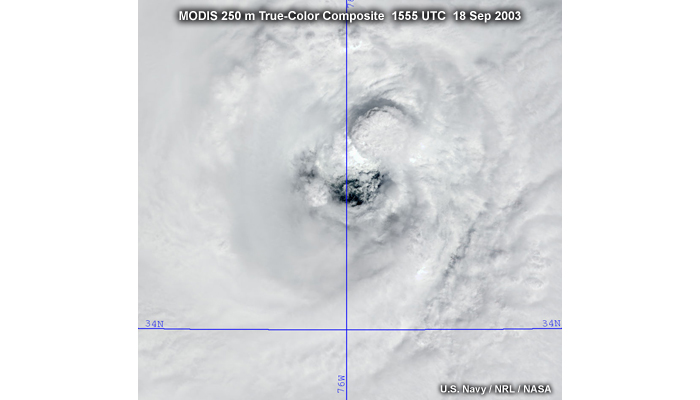
Let’s go on to the 250-meter spatial resolution of MODIS. This MODIS image previews the VIIRS capability to create high-resolution, true-color imagery, similar to what an airborne hurricane hunter would see flying straight into the storm’s eye.
5.7 Combining True Color and High Resolution: Bangladesh Coastline
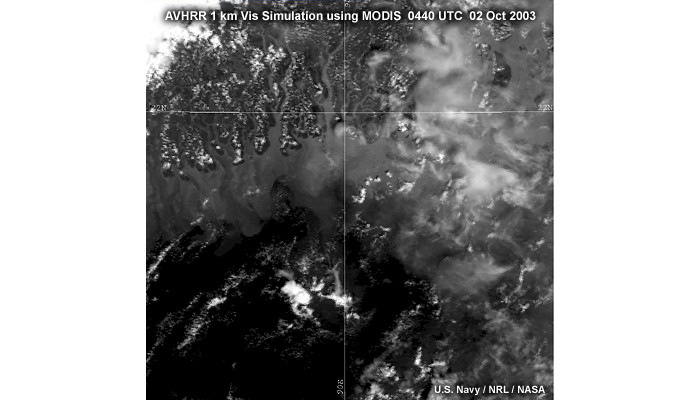
Let’s examine the combined effect of high spatial resolution and true-color capability in MODIS imagery. To illustrate a point, we will degrade the MODIS resolution to 1 kilometer in order to get a black and white image like the AVHRR or OLS would produce. The image shown is a visible close-up over Bangladesh. But a first-time observer unfamiliar with this part of the world might be pretty baffled. What’s water, what’s land, what’s cloud? In short, what’s what in this jumble of grey shades?
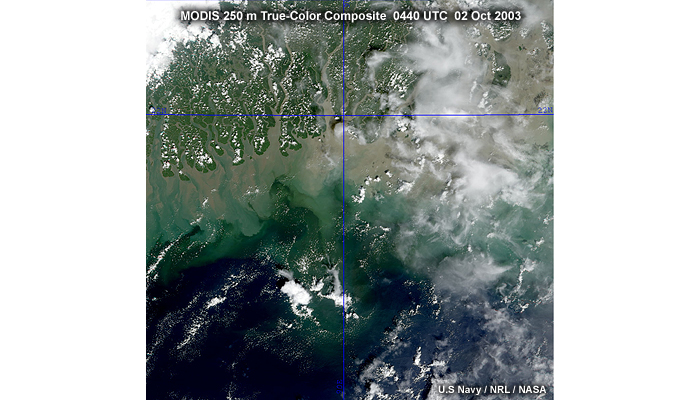
In this second image two things are better: it’s now true color, and it’s also high resolution at 250 meters. Notice how information about the scene now pops out at you. We can see, for example, heavy sedimentation in the coastal waters, ocean sunglint in blue in the southeast, and cumulus cloud fields. Shadows suddenly jump out. In the black and white product it was hard to tell clouds from the surface in the northwest. But clouds are white in the true color so that distinguishing them from the surface becomes much easier.
5.8 Combining MODIS True Color and High Resolution: San Diego Coastline
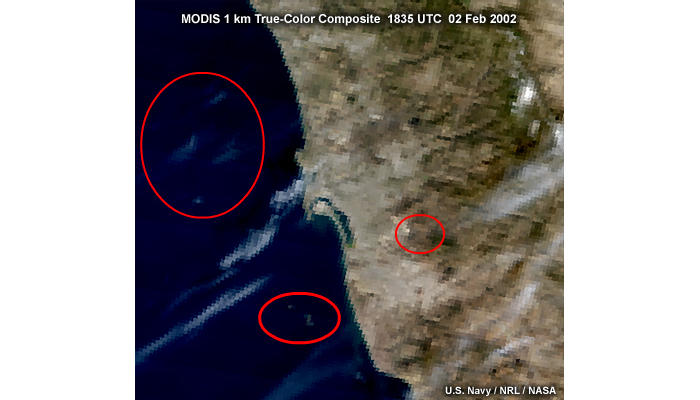
Now let’s look at some high-resolution multispectral imagery over the San Diego area of southern California. In the 1-kilometer image look at the features within the ovals. It’s hard to know exactly what they contain.
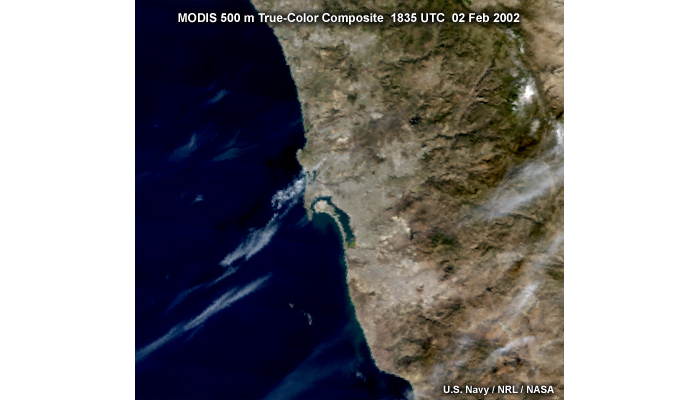
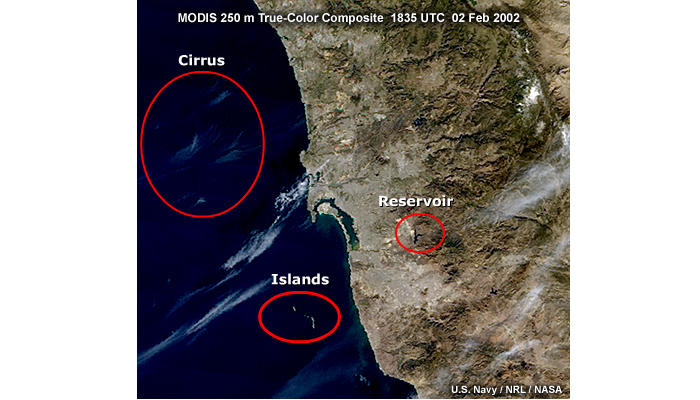
But if you zoom in to 500 meters, and then 250 meters, everything comes into focus. The northern oval contains thin, wispy cirrus. The southern oval over water contains islands. And the oval over land contains a reservoir.
5.9 MODIS Monitoring Volcanic Ash
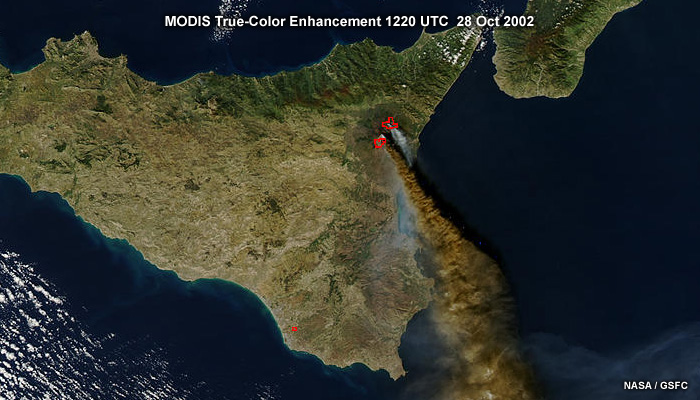
The monitoring of volcanic ash has become a crucial application for satellite remote sensing. Ash damages jet engines, which can cripple even the largest airplanes. Here is a true-color image of Sicily in the Mediterranean Sea. Red dots mark overlays of the actual eruptions as detected by the MODIS shortwave infrared channels, which are sensitive to hot spots.
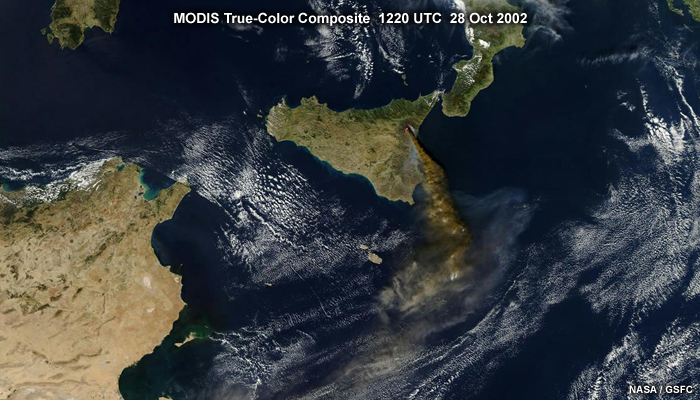
Notice that there are actually two volcanic plumes of different colors which merge offshore to the south. Often, the 11- and 12-micrometer channels, referred to together as the “split window,” are used for 24-hour monitoring of these plumes. With improved timeliness of the data, monitoring of volcanic eruptions will be easier in the VIIRS era.
5.10 MODIS Imaging Fog from Space
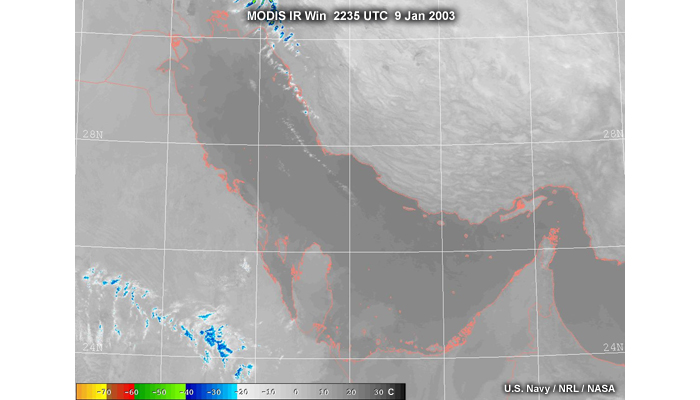
AVHRR brought a major advance in the detection and analysis
of low clouds and fog at night. Amazingly, scientists developed low cloud algorithms
using channels never intended for that purpose. In fact, the requisite 3.7-micrometer
channel was placed on the sensor for sea surface temperature analysis! Here
is how the fog product works using MODIS data as an example. In this nighttime
infrared image high clouds show up easily and are highlighted in blue and green
shades. But where are the low clouds? Knowledge of where low clouds are located
is crucial for a variety of applications. Indeed, there are low clouds in this
scene, but their temperature closely matches the temperature of the land and
sea background, so that they in effect disappear.
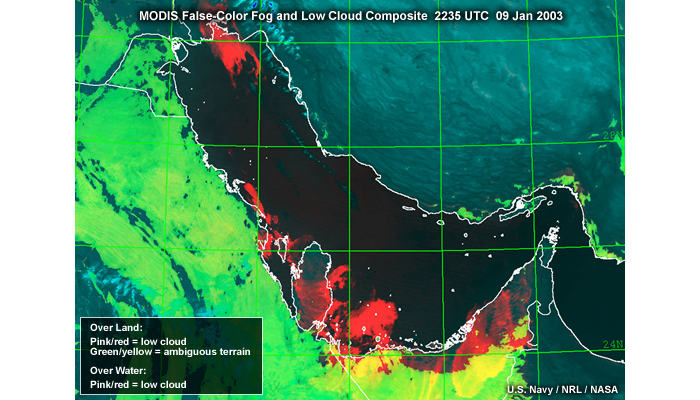
The fog product exploits the fact that low clouds have different emissivities in two of the infrared channels. When the two channels are combined as in this color composite of the same scene, low clouds and fog now appear in red.
5.11 Combining True
Color and High Resolution:
Red Tides near the Florida
Coastline
The advanced MODIS capabilities give us sharper detail and the ability is to quantify and understand bio-optical properties of the surface of the ocean, often called "ocean color." Ocean color depends on the number of microscopic marine plants, called "phytoplankton." These plants contain chlorophyll, a green pigment.
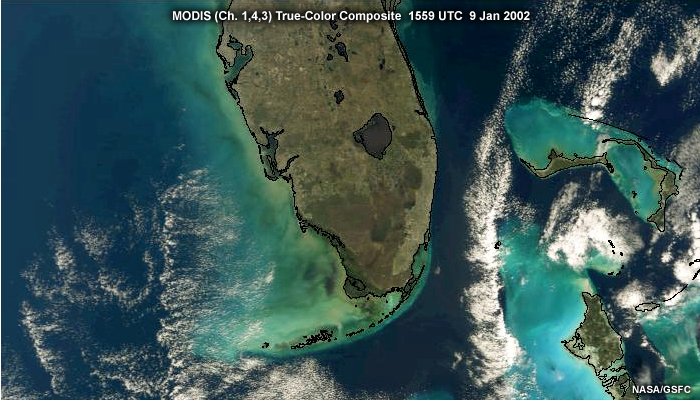
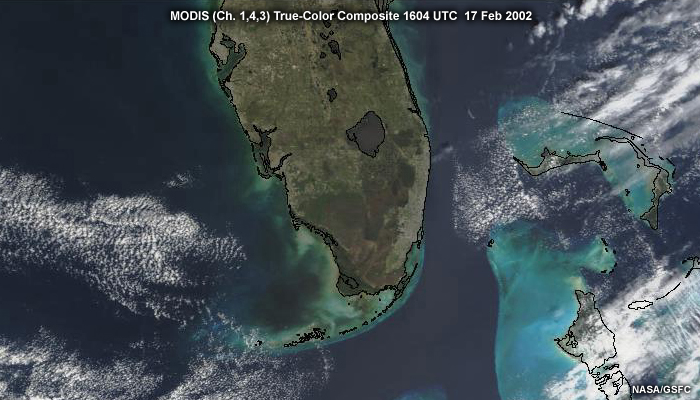
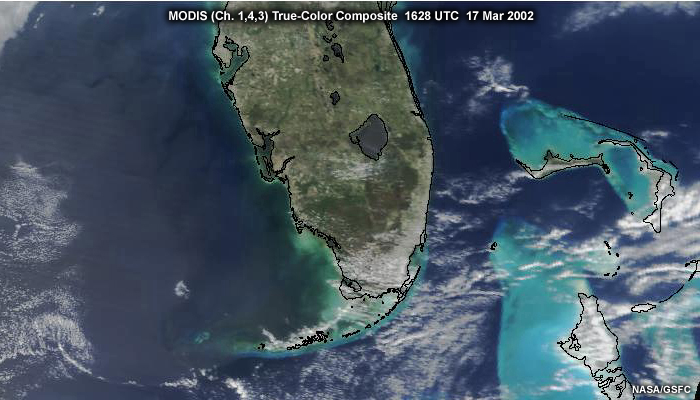
The waters of Florida are normally bluish green as shown in the top image. But in December 2002 a mysterious region of black water appeared in this region. The feature is shown prominently in the middle image, taken in mid-February. It diminished a few weeks later as seen in the bottom image. The black color was caused by a high concentration of microscopic plants and other dissolved matter, sometimes known as a red tide, but it appears black in MODIS imagery.
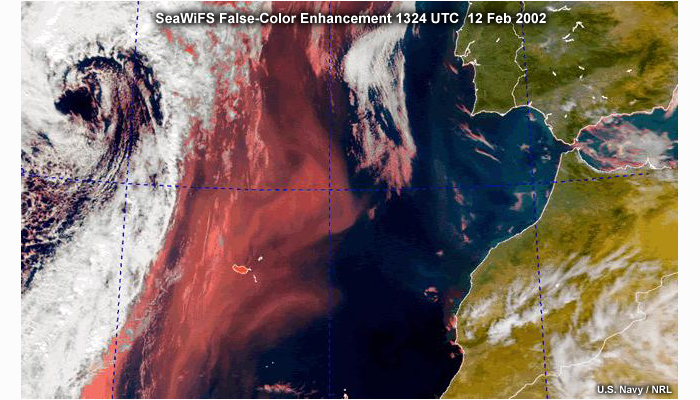
A popular use of SeaWiFS is for dust and aerosol detection over the ocean. This is a SeaWiFS dust enhancement that resembles a color enhancement we saw earlier for MODIS, but is designed to bring out suspended dust. Look at how the dust, shown in an orange-pink, is moving northeastward ahead of an approaching frontal system.
6.0 The Nighttime Visible Channel
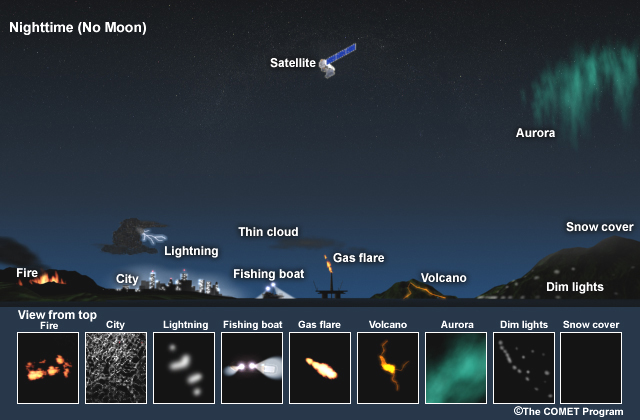
Besides great spatial resolution, the DMSP OLS also has the Day/Night channel, with the capability of imaging with or without moonlight. The images from this channel are increasingly sought after, but many users don't understand them well. What are all the features that can be seen?
6.1a OLS and VIIRS Day/Night Channels
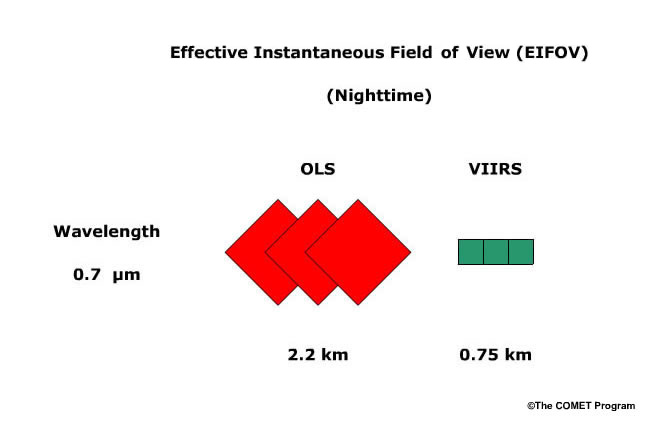
The main DMSP OLS contribution to VIIRS is the legacy of the
nighttime visible channel. The VIIRS improvement can be best understood by using
a measure known as the effective instantaneous field of view (EIFOV).
This is the earth area viewed by the satellite in a single snapshot and represents
the ability of the satellite to resolve features without blurring. The larger
this value, the more overlap there is between adjacent EIFOVs and the worse
the image quality. Notice the threefold decrease in EIFOV with VIIRS, compared
to OLS nighttime sensor. This improvement marks a crucial enhancement in the
ability to observe lights associated with smaller cities and fires.
Whether natural or generated by humans, lights on the earth and in the atmosphere are brightest in the Day/Night channel when there is little or no moon. The sensitivity to light on the sensor is increased to detect faint city lights, lightning, lights from fishing boats, gas flares from offshore oil platforms, and molten lava from volcanoes. Of great interest to the space weather community, the aurora can often be seen prominently over polar regions. The lights from middle-sized and major cities easily penetrate most clouds, and only the thickest clouds, like this thunderstorm, can prevent lights from being detected by the satellite. However, without reflected lunar illumination, the clouds themselves cannot be seen by the sensor.
6.3 Half Moon, First Quarter Phase
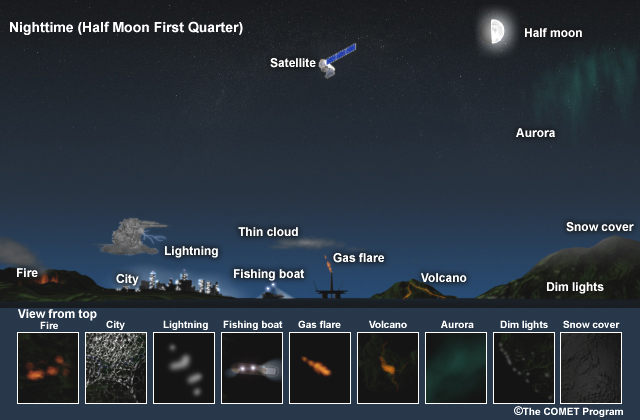
With half of the lunar face showing, the moon is in its first
quarter phase. With increasing lunar phase and illumination, the gain is decreased,
and clouds come dimly into view. Many of the dimmer light sources may become
undetectable on successive nights during this period.
A rule of thumb is that clouds can be seen in quarter-moon phase and above,
but this is not a completely reliable indicator.
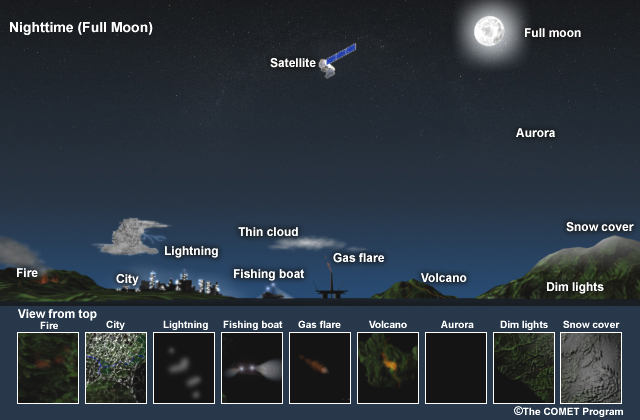
During a full moon the gain is at a minimum, making city lights appear at their faintest. But clouds can be seen vividly in the reflected moonlight. Snow on the ground can be seen, and land/sea boundaries become distinct. Under a full moon, nighttime visible images resemble daytime visible images.
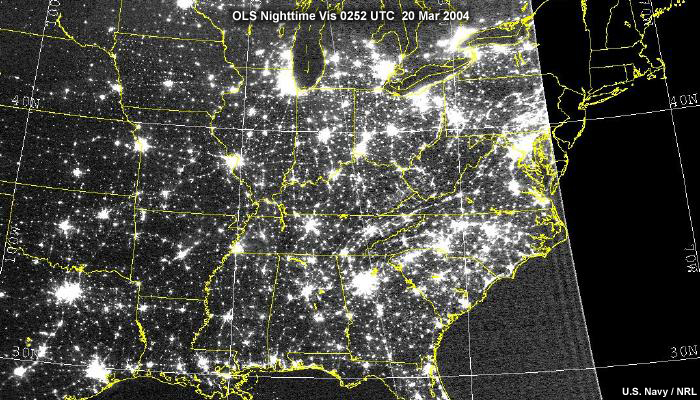
Let’s look at some real examples taken during the lunar cycle. With no moon we just see city lights and no clouds. This is because without lunar reflection, only self-sufficient light sources show up. The instrument gain is set on high in the absence of moonlight so that even small towns and shopping centers along highways become visible.
6.6 Moon - Nearly Half Full Image
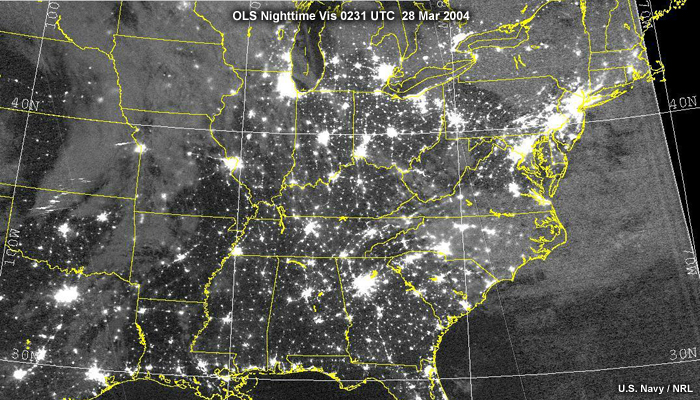
A few days later clouds start to appear in the imagery. However, even with a half moon, the clouds are somewhat indistinct. More moonlight is needed for better imaging. One advantage of this channel is that even thick clouds do not completely obscure bright city lights on the ground. For example, look at the cities that appear through the clouds in Iowa. In other areas, however, the lights are not city lights at all, but lightning. Notice the lightning embedded within the squall line in northern Oklahoma.
6.6a More Information on Lightning with the Nighttime Visible Channel
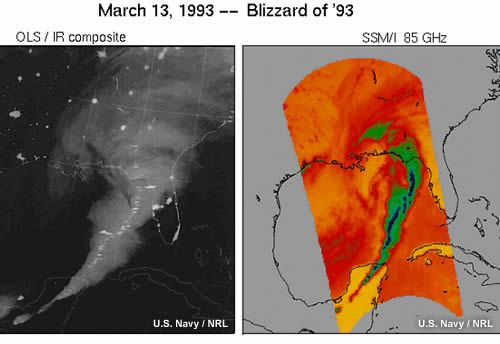
Let’s examine this nighttime visible image of the Blizzard
of ’93 in the early stages of the storm’s development. Notice that
you can see cities through some of the thinner cirrus. The mostly horizontal
streaks along the squall line over the Gulf of Mexico are actually lightning
flashes that can be seen in the very low light conditions at night. Can you
tell the difference between the flashes and the city lights?
On the right is a Special Sensor Microwave Imager (SSM/I) image from the same
DMSP satellite. This 85-GHz image shows the precipitation from the same system
shown by the visible image on the left. The low microwave temperatures represented
by embedded greens and blues indicate ice-phase precipitation aloft, and heavy
rain at the surface.
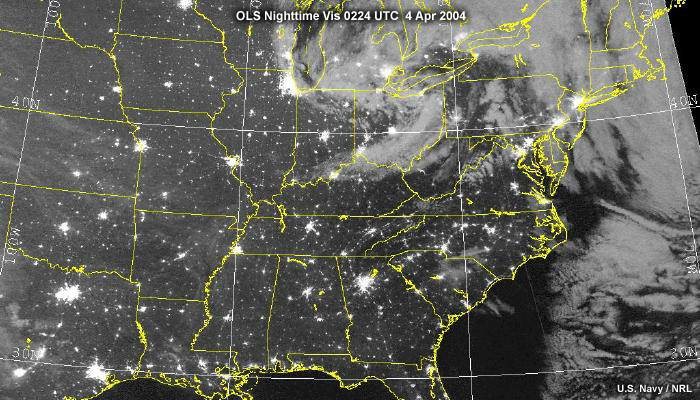
Now at full moon, clouds are more fully illuminated. Since the instrument gain is decreased during a full moon to avoid saturation by brightly reflective clouds, cities will grow relatively dimmer. But they do not go away altogether. Notice that the highway grid is more difficult to see in this image than in the “no moon” image.
6.7a Solar Glare Contamination
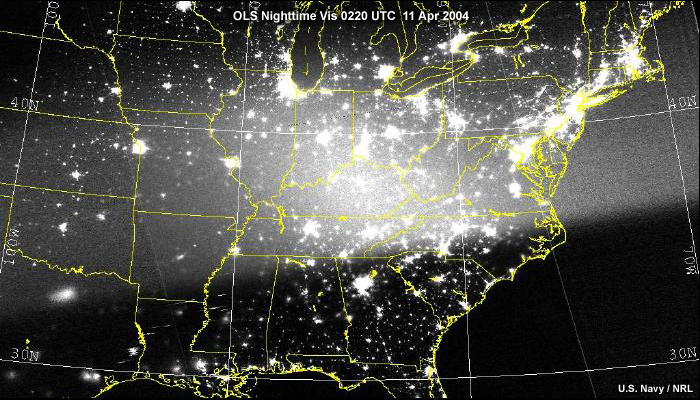
The moon is about three-quarters full in this image, more than sufficient for cloud imaging. But why are there are no clouds visible? The answer is that the moon is below the horizon and not illuminating the scene. There is, however, considerable solar glare over a portion of the scene. Solar glare appears during particular sun/satellite geometry configurations when the sun shines into the sensor. The VIIRS instrument will eliminate this problem.
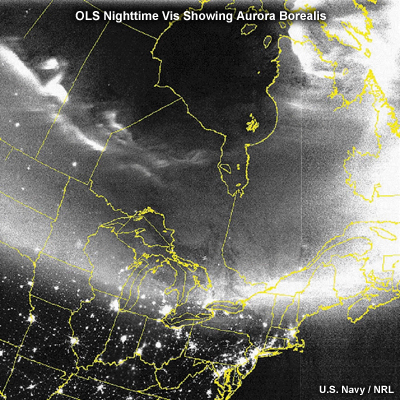
With little or no moon, the OLS can detect one of the most visually amazing space weather phenomena, the aurora. Here is an example of the aurora borealis over the eastern United States. The aurora is a vibrant array of light in the night sky, caused by charged particles from the sun interacting with the earth's magnetic field in the ionosphere. The aurora borealis (northern lights) appear in the northern hemisphere.
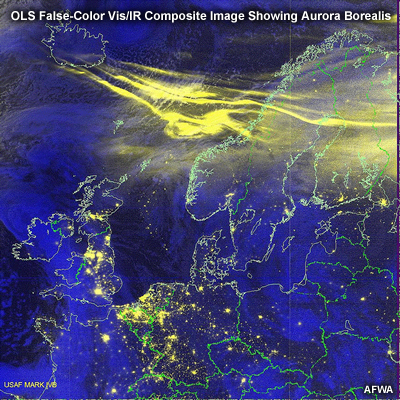
This image is a false color composite of the aurora borealis using OLS infrared and nighttime visible data over Europe.
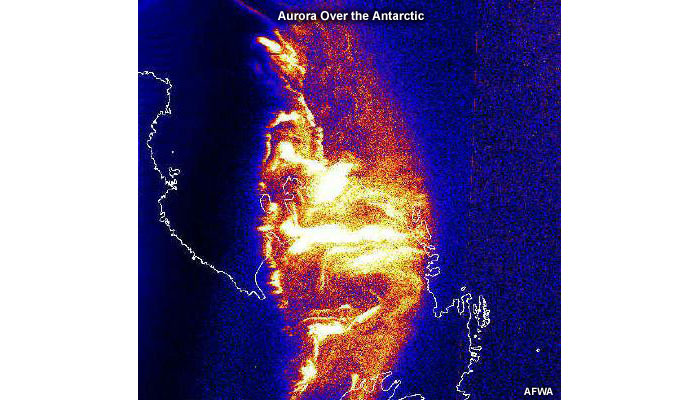
The aurora australis (southern lights), with innumerable spatial forms, is the southern hemisphere counterpart.
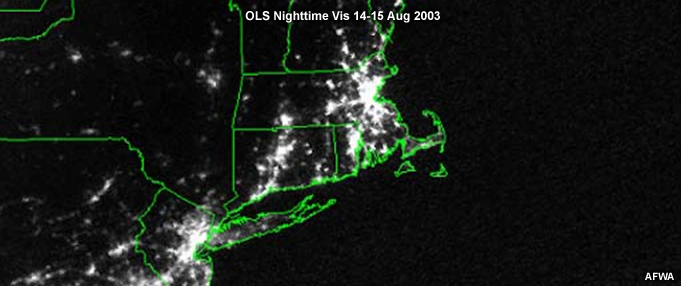
A typical DMSP OLS nighttime view of northeastern U.S. lights seems normal at first glance. You can see cities such as New York City.
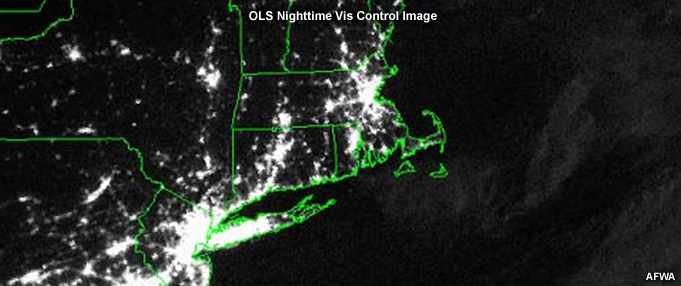
But wait; let's compare this image to one on a previous night with more and brighter lights. The first "dim" image is of the great power blackout on 14-15 August 2003. This example illustrates how the VIIRS Day/Night visible channel will be a significant tool to emergency personnel attempting a quick assessment during power outages.
6.10 Clouds Obscure View Over Texas: No Moon Case
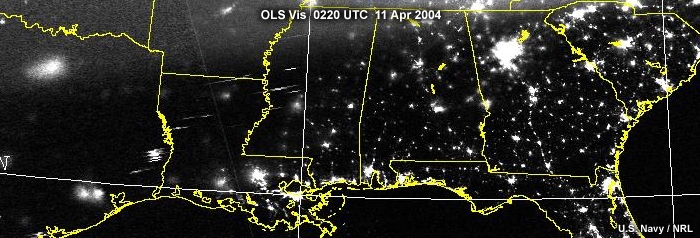
Should you assume a blackout if you do not see familiar cities
at night? Look at the DMSP OLS visible image. City lights are prominent over
the southeast. Over Georgia, for example, you can see the towns that line Interstate
75. Cities also dot Alabama and parts of Mississippi. But over much of Louisiana
and especially Texas very few cities appear, with the exception of Houston in
the south and Dallas Fort Worth in the north. The problem is not a blackout,
but heavy clouds which obscure the cities in Texas. Since there is no moon,
those clouds do not appear in the image.
There are two ways of determining that it’s overcast and not a blackout.One,
you can notice the diffuse appearance of the lights from Houston or Dallas Fort
Worth. This is caused by partial attenuation of the light by heavy overcast.
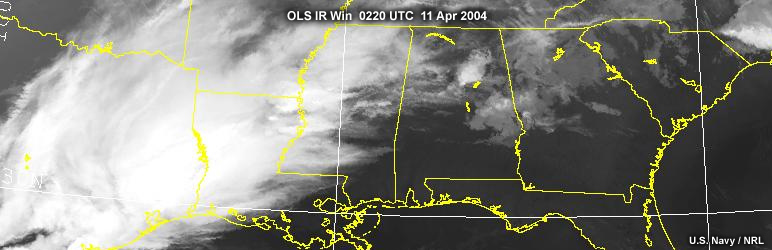
Or, you can look at the infrared image to see the clouds.
6.10a More Information
on Nighttime Cloud Imaging:
Cloud Identification Using the OLS IR and Nighttime
Visible Channel
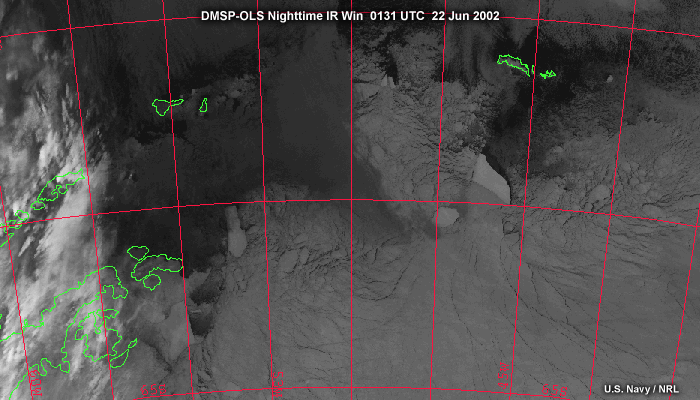
In the Antarctic night, the infrared is often transmitted in fine mode, with the visible in smooth mode. Given the absence of daylight, IR images give the most useful information about clouds and ice. Look at this fine resolution image over a portion of the Antarctic. In the infrared image you can see elaborate detail over the ice shelf. But clouds obscure much of the scene, especially in the west.
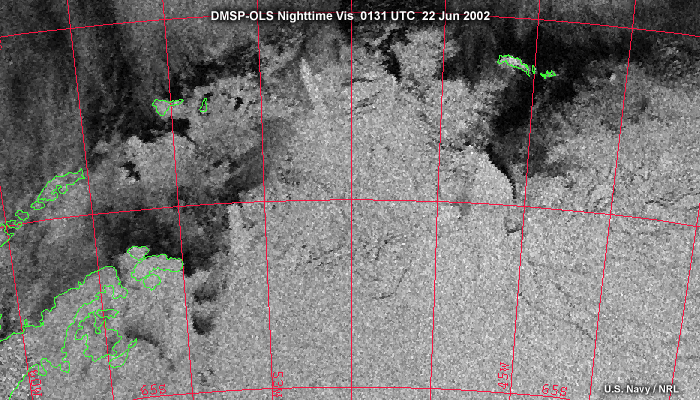
Because reflected moonlight penetrates the thin Antarctic clouds in the visible image, we can see the edge of the ice sheet in various places that were obscured in the infrared image.
6.11 Bispectral Composite for Highlighting Clouds
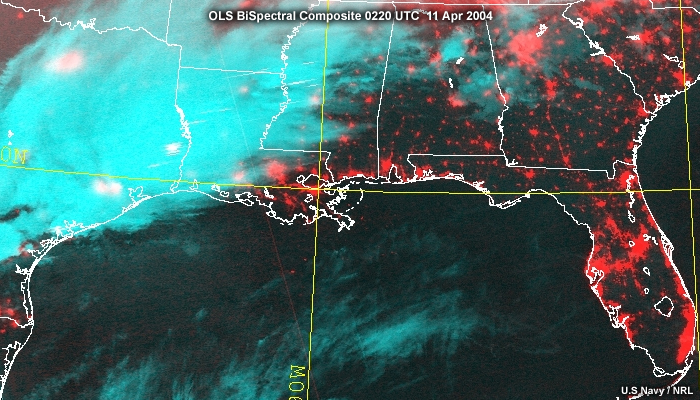
A composite image that combines infrared and visible components can eliminate the need to view each image separately. The previous infrared image was assigned to the blue and green color guns, and the visible was assigned to the red color gun. With the composite it is easy to see that Texas is cloud covered, explaining the diffuse appearance of cities. On the other hand Georgia has few clouds overhead, which allows cities to stand out.
6.12 Tropical Cyclone Imaging at Night
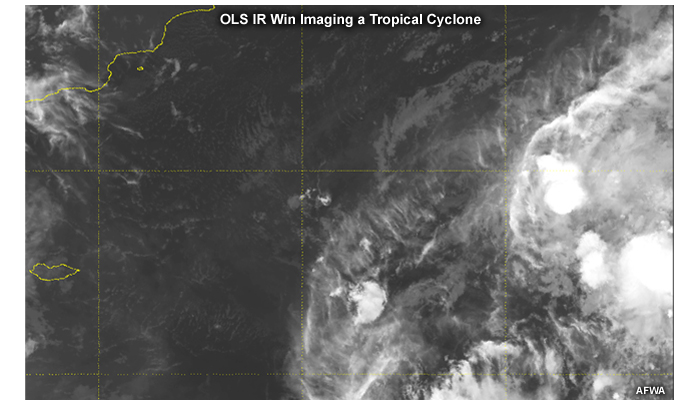
Another useful application for the nighttime visible is the imaging of tropical cyclone circulations at low levels. In other words, those circulations not associated with mid- or high-level cloud features. Let’s look first at the DMSP infrared image. The infrared image naturally highlights cirrus. But can you see any trace of a low-level circulation here?
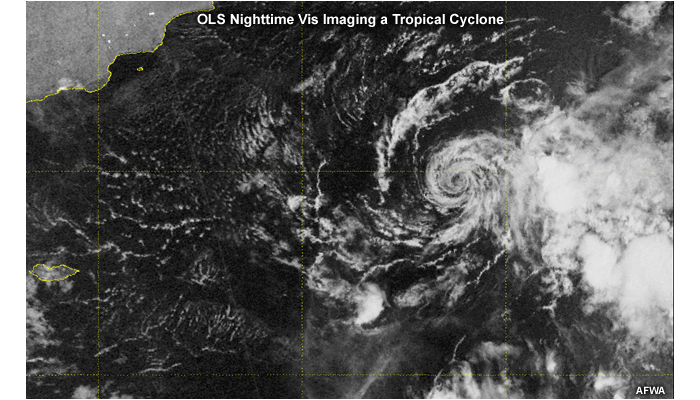
Now let’s look at a nighttime visible image under moonlight. The low cloud circulation associated with the storm shows up easily. Such a capability can be crucial for detection and estimating intensities of relatively weak tropical storms during nighttime hours.
Quick Quiz: (Assume that the moon is above the horizon.) Can
you tell the phase of the moon when this image was taken?
Answer: New moon, or near to it. There is little illumination to show clouds.
Section 1: Introduction
Section 2: VIIRS Resolution Improvements
Section 3: DMSP Contributions
Section 4: Edge-of-Scan Effects
Section 5: True-Color Imagery with VIIRS
Section 6: Day/Night Channel
Glackin, D.L., Cunningham, J.D., and C.S. Nelson, 2004: Earth remote sensing with NPOESS: instruments and environmental data products. Sensors, Systems, and Next-Generation Satellites VII, Proc. SPIE, 5234, 123-131.
Johnson, D.B., P. Flamant, and R.L.Bernstein, 1994: High-resolution satellite imagery for mesoscale meteorological studies. Bull. Amer. Meteor. Soc., 75, 5-33.
Jones, D., 2004: NPOESS: The next generation system, Earth Observation Magazine, 13, 4-11.
Schueler, C.F., et al., 2003: NPOESS VIIRS: next-generation polar-orbiting atmospheric imager. Optical Remote Sensing of the Atmosphere and Clouds III, Proc. SPIE, 4891, 50-64.
Schueler, C.F., et al., 2002: NPOESS VIIRS sensor design overview. Earth Observing Systems VI, Proc. SPIE, 4483, 11-23.