Overview
The Regional and Mesoscale Meteorology (RAMM) Advanced Meteorological Satellite Demonstration and Interpretation System (RAMSDIS) web site displays real-time products created and/or developed by NOAA/NESDIS/STAR/RAMMB and associated CIRA scientists over the last 30 years. While there is some overlap with other web pages an effort has been made to show unique products not displayed elsewhere.
History
RAMSDIS started in response to the need to distribute imagery from the Geostationary Operational Environmental Satellite GOES-I series launched in the mid-1990s by Deb Molenar and Jim Purdom. By the early 2000s, RAMMB began to extend RAMSDIS to include interactive online capabilities via RAMSDIS Online and RAMSDIS Online Experimental by using McIDAS-X. RAMSDIS online was part of this extension. RAMSDIS online included a mixture of floaters positioned over areas of interest and large area domains over global tropical cyclone ocean basins to provide visible, longwave window channel infrared, and longwave absorption water vapor channel infrared from geostationary, total precipitable water from low-Earth, sea surface temperature, and 89-GHz microwave brightness temperatures.
As technology advances and website capabilities expand, RAMSDIS is continuing to morph and evolve with this new RAMSDIS website, which uses the Python programming language to generate satellite products and run the webapp and SSEC HTML5 Image AnimationS webapp for the sector looper. The new RAMSDIS exploits the multispectral capabilities of the imagers on the current global constellation of geostationary satellites.
References:
Molenar, D. A., Schrab, K. J., and Purdom, J. F. W., 2000: RAMSDIS Contributions to NOAA Satellite Data Utilization, Bulletin of the American Meteorological Society, 81, 1019–1030. https://doi.org/10.1175/1520-0477(2000)081<1019:RCTNSD>2.3.CO;2
Sectors
Floaters
Floater sectors are 16° × 9° in size and cover regions of meteorological interest (e.g., tropical cyclones). Regions of interest are selected by RAMMB and CIRA scientists. The floaters might be fixed in space or feature following.
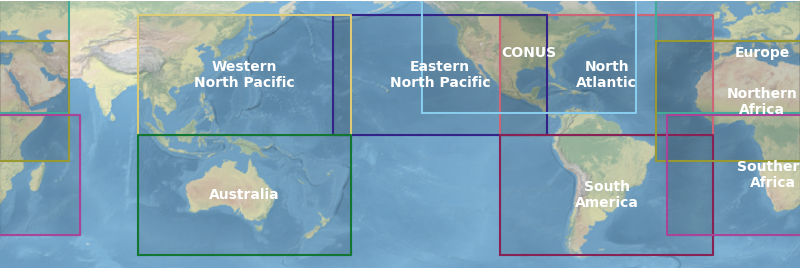
Large-area/Basin-scale
Large-area/basin-scale sectors are 112° × 54° in size focus on ocean basins (e.g., North Atlantic, eastern North Pacific).
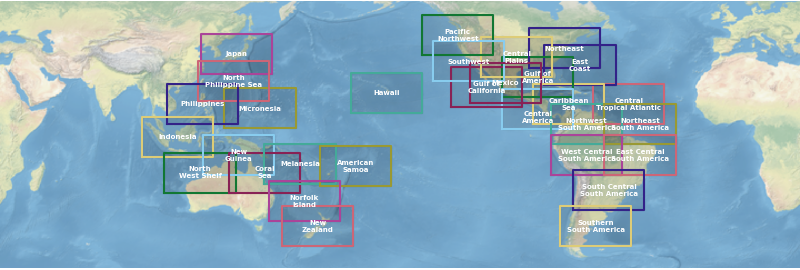
Sub-region/sub-basin
Sub-region/sub-basin sectors are 32° × 18° in size focus on sub-ocean areas that may be of interest.
Product Overlays
Geostationary level 2 baseline products
From the GOES-R series baseline products, RAMSDIS displays the derived motion winds (DMW) product. This product is a replacement for the legacyatmospheric motion vector (AMV) product. For the product displayed on RAMSDIS, DMWs from all available channels are used.
The wind barbs are displayed in knots (1 kt ≈ 0.51 m s-1) with the barbs color coded by height:
- Blue is for 600 hPa to the surface.
- Yellow is for 450 to 600 hPa.
- Red wind barbs are for winds between 0 and 450 hPa.
For details on the GOES-R series baseline products, please see VISIT Quick Guides listed below.
Group for High-Resolution Sea Surface Temperature (SST) (GHRSST) Level 4 product
RAMSDIS displayed sea surface temperature from the Group for High-Resolution Sea Surface Temperature (SST) (GHRSST) Level 4 product.
The sea surface temperature contours are displayed in degrees Celcius and color coded by temperature:
- Blue is less than 26°C.
- Yellow is between 26°C and 29°C.
- Red is greater than 29°C.
NCEP Global Forecast System
The NCEP Global Forecast System numerical weather prediction model is used to generate diagnostic fields.
- 200-hPa Divergence
- 500-hPa Geopotential Height
- 850-hPa Relative Vorticity
- Shear
Geostationary Satellite Products
Geostationary satellite products are generated from the global constellation. Currently, RAMSDIS uses GOES-16/-17 and Himawari-8/9 with plans to extend to GEO-KOMPSAT-2A and Meteosat Second and Third Generation.
From these satellites, we generate the following products
Band Imagery
Band imagery comes from an individual channel available from the imager. RAMSDIS creates a visible / shortwave infrared blend for day and night, respectively. In addition, RAMSDIS produces imagery for the infrared window channel (near 11 µm) and water vapor (near 6.9 µm). The infrared and water vapor imagery used enhancements created by retired RAMMB employee Ray Zehr.
For details on each of the four bands used, please see VISIT Quick Guides for GOES-R satellites listed below.
- GOES-R ABI Band 2 (0.64 µm) Quick Guide (PDF)
- GOES-R ABI Band 7 (3.9 µm) Quick Guide (PDF)
- GOES-R ABI Band 9 (6.9 µm) Quick Guide (PDF)
- GOES-R ABI Band 13 (10.3 µm) Quick Guide (PDF)
- GOES-R ABI Band 15 (12.3 µm) Quick Guide (PDF)
RAMSDIS uses enhancement tables to create the band imagery. These tables are typically in 8-bit color.
Note that the 6.9 µm water vapor absorption band is often referred to as "mid-level" for middle-latitude meteorological applications. In the tropics, the weighting function is shifted higher in the atmosphere so this intepretation can be misleading. Also, warm brightness temperatures in the water vapor absorption band does not necessarily mean that the air is dry. Please see the Satellite Hydrology and Meteorology (SHyMet) GOES-R water vapor channel weighting function training by CIMSS's Scott Backmeier and Scott Lindstrom.
Multispectral RGB Imagery
A popular approach to using imagery is to combine multiple bands through using the red, green, and blue (RGB) color model. Satellite RGB's can be challenging to interpret as a specific red, green, and blue combination can have multiple meanings or change meanings depending on atmospheric conditions.
RGB imagery is created by normalizing the input between 0 and 1 for each channel using the following equation:
\[
\mathsf{Value}_\mathsf{Channel, Out} = \left(\frac{\mathsf{Value}_\mathsf{Channel, In} - \mathsf{MIN}}{\mathsf{MAX} - \mathsf{MIN}}\right)^\left(\mathsf{1/Gamma}\right),
\]
where \(\mathsf{Value}_\mathsf{Channel, In}\) is the input data in brightness temperature or reflectance, \(\mathsf{MIN}\) and \(\mathsf{MAX}\) are the minimum and maximum allowed values for the channel in brightness temperature or reflectance, \(\mathsf{Gamma}\) is called the gamma correction parameter and provides another means for shaping the channel data, and \(\mathsf{Value}_\mathsf{Channel, Out}\) is the normalized channel output from 0 to 1.
Note that: \(\mathsf{Value}_\mathsf{Channel, Out}\) is often multiplied by 255 to generate 24-bit true color RGB imagery. Also, the gamma correction parameter, \(1 / \mathsf{Gamma}\), might also be defines as \(\mathsf{Gamma}\) depending on the source for an RGB recipe and in systems like Advanced Weather Interactive Processing System II. However, this convension lacks consistency with the World Meteorological Organization standard.
For details on each multispectral RGB displayed here on RAMSDIS, please see the information listed on this page or VISIT Quick Guides listed below.
- Day Cloud Convection RGB Quick Guide (PDF)
- JMA Day Cloud Phase Distinction RGB Quick Guide (PDF)
- EUMETSAT Tropical Airmass/Overshooting Tops RGB Quick Guide (PDF)
- EUMETSAT Dust RGB Quick Guide (PDF)
Cloud Convection RGB
The Cloud Convection RGB is a legacy RGB product that assists with distinguishing between high and low clouds. The cloud convective RGB uses visible imagery near 0.64 µm for red and gred and 10.3 µm as blue. Low to mid level water clouds are in shades of yellow and upper-level cirrus and convection range from blues to white.
| RGB Interpretation | |
|---|---|
| Low to mid level water clouds (shades of yellow) |
|
| Land with sparse vegetation (olive green) |
|
| Upper-level clouds (shades of white and gray) |
|
| Thin cirrus (shades of blue-gray) |
|
| Water, flooded areas, and forested areas (dark blue) |
|
| RGB Recipe | |||||
|---|---|---|---|---|---|
| Color | ABI Band | Central Wavelength [µm] |
Minimum Value [°C/%] |
Maximum Value [°C/%] |
Gamma |
Red |
2 | 0.64 | 0 | 100 | 1.7 |
Green |
2 | 0.64 | 0 | 100 | 1.7 |
Blue |
13 | 10.3 | 49.85 | -70.15 | 1 |
Day Cloud Phase Distinction RGB
The Day Cloud Phase Distinction RGB provides contrast between various cloud layers by exploiting cloud phase reflectance properties from the near infrared.
| RGB Interpretation | |
|---|---|
| Low level clouds with water droplets (cyan, lavender) |
|
| Glaciating clouds (green) |
|
| Thick high level clouds with ice particles (yellow) |
|
| Thin mid level clouds with water droplets (magenta) |
|
| Thin high-level clouds with ice particles (red-orange) |
|
| Land surface (shades of blue) |
|
| Water surface (black) |
|
| RGB Recipe | |||||
|---|---|---|---|---|---|
| Color | ABI Band | Central Wavelength [µm] |
Minimum Value [°C/%] |
Maximum Value [°C/%] |
Gamma |
Red |
13 | 10.3 | 7.5 | -53.5 | 1 |
Green |
2 | 0.64 | 0 | 78 | 1 |
Blue |
5 | 1.6 | 1 | 59 | 1 |
Tropical Overshooting Tops RGB
| RGB Interpretation | |
|---|---|
| High ice clouds (pink shades) |
|
| Very high,thick ice clouds (off white) |
|
| Mid clouds (tan to red) |
|
| Warm air mass, less moisture (brown) |
|
| Warm air mass, more moisture (dark green or blue) |
|
| Jet stream / PV / deformation zones / dry upper level (dark red/orange) |
|
| RGB Recipe | |||||
|---|---|---|---|---|---|
| Color | ABI Band | Central Wavelength [µm] |
Minimum Value [°C/%] |
Maximum Value [°C/%] |
Gamma |
Red |
8 - 13 | 6.2 - 10.3 | -25 | 5 | 1 |
Green |
12 - 13 | 9.6 - 10.3 | -30 | 25 | 2.5 |
Blue |
8 | 6.2 | -30.15 | -83.15 | 1 |
Dust RGB
The Dust RGB assists with providing contrast between optically thin dust and land and ocean surfaces. Dusts appear in shades of magenta or pinks.
| RGB Interpretation | |
|---|---|
| Dust plume (magenta, pink) |
|
| Low, warm water cloud and/or thick dust (light purple shades) |
|
| Desert surface (day) (light blue) |
|
| Mid, thick clouds (tan shades) |
|
| Mid, thin clouds (green) |
|
| Cold, thick clouds (red) |
|
| High, thin ice clouds (black) |
|
| Very thin cloud (over warm surface) (blue) |
|
| RGB Recipe | |||||
|---|---|---|---|---|---|
| Color | ABI Band | Central Wavelength [µm] |
Minimum Value [°C/%] |
Maximum Value [°C/%] |
Gamma |
Red |
15 - 13 | 12.3 - 10.3 | -6.7 | 2.6 | 1 |
Green |
14 - 11 | 11.2 - 8.4 | -0.5 | 20.0 | 2.5 |
Blue |
13 | 10.3 | -11.95 | 15.55 | 1 |
Low-Earth Satellite Products
NESDIS Blended Total Precipitable Water Product
The product displayed on RAMSDIS used the ALPW enchancement created by CIRA employee Stan Kidder.
For details on the NESDIS Blended Total Precipitable Water product, please see the NESDIS STAR product page below:
References:
Kidder, S. Q., and Jones, A. S., 2007: A Blended Satellite Total Precipitable Water Product for Operational Forecasting, Journal of Atmospheric and Oceanic Technology, 24, 74–81. https://doi.org/10.1175/JTECH1960.1
CIRA Advected Layer Precipitable Water Product
The CIRA Advected Layer Precipitable Water (ALPW) product uses Microwave Integrated Retrieval System (MiRS) retrievals of moisture and temperature derived from 7 polar orbiting satellites to generate a four-dimensional perspective of atmospheric moisture. The product provides precipitable water retrievals in four layers:
- surface to 850 hPa,
- 850 hPa to 700 hPa,
- 700 hPa to 500 hPa, and
- 500 hPa to 300 hPa.
The product displayed on RAMSDIS used the ALPW enchancement created by CIRA employee John Forsythe.
For details on CIRA ALPW, please see VISIT Quick Guides listed below.
References:
Forsythe, J. M., S. Q. Kidder, K. K. Fuell, A. LeRoy, G. J. Jedlovec, and A. S. Jones, 2015: A multisensor, blended, layered water vapor product for weather analysis and forecasting. Journal of Operational Meteorology, 3, 41–58. http://dx.doi.org/10.15191/nwajom.2015.0305